Here’s how the demographic and economic statistics look for candidate members of the European Union

We will be publishing a number of statistics for the United Kingdom (and the European Union) over the next few days in the run up to a major piece we will be publishing on the real economics of Brexit.

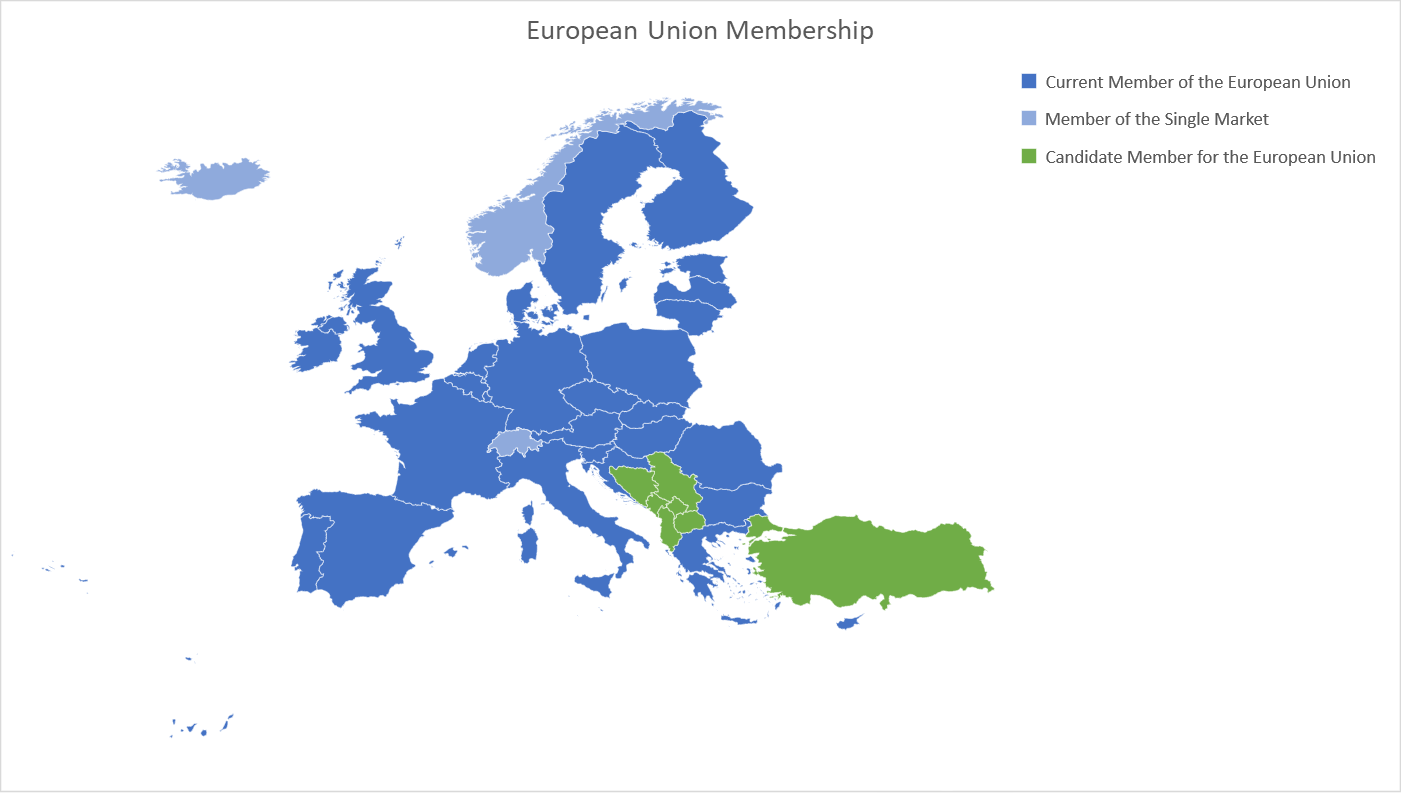
Montenegro, the former Yugoslav Republic of Macedonia, Albania, Serbia, Turkey, Bosnia and Herzegovina and Kosovo are countries on the road to join the European Union.

European Union Membership 2018
Compiled by thistimeitisdifferent.com


Continue reading “Here’s how the demographic and economic statistics look for candidate members of the European Union”

The U.S. economy is set to contribute its highest share of global GDP since 2007 as other economies everywhere else stumble

The U.S. economy is doing great and is set to contribute 25% of global Gross Domestic Product (GDP) this year, its highest share since 2007. The rise of the U.S. dollar and increases in interest rates are squeezing emerging economics at an unprecedent pace. But it isn’t just emerging economies that are feeling the squeeze, Europe has its problems with Italian debt (and yields), the Australian dollar which has long been considered a growth asset has been falling this year and elsewhere trade worries and rising oil prices are having a big impact on other nations. Even German factory orders are the weakest in years as the U.S. is truly taking back economic leadership.

Continue reading “The U.S. economy is set to contribute its highest share of global GDP since 2007 as other economies everywhere else stumble”

Canadian household credit growth is slowest since 2001 but individual debt is already 175 percent of disposable income

Canadian household credit growth is slowest since 2001 with Household credit (Annualized 3-month growth rate) growing at 2.98% and Household Mortgage credit (Annualized 3-month growth rate) growing at 2.85%.

Canada household credit growth up to June 2018
Data Source: Bank of Canada

Continue reading “Canadian household credit growth is slowest since 2001 but individual debt is already 175 percent of disposable income”

U.S. Inflation at 2.9% is the highest since February 2012 and has outstripped wage growth for the first time since October 2012

U.S. Consumer Inflation at 2.9% is the highest since February 2012. And it isn’t just energy prices causing inflation to soar. Core inflation (which is Consumer inflation excluding volatile energy and food prices) at 2.4% has risen at the fastest pace in a decade. Here is a chart for CPI inflation growth,

US CPI August 2018
Source: Source: U.S. Bureau of Labor Statistics

Continue reading “U.S. Inflation at 2.9% is the highest since February 2012 and has outstripped wage growth for the first time since October 2012”

History is repeating itself, is this the end of the current cycle of global synchronised growth?

We wrote earlier this year on the downsides of synchronised global growth. We wrote that when global synchronised growth begins to end the U.S. dollar strengthens, investors run away from emerging markets, interest rates continue to rise to tame inflation and bad debt becomes an issue. All of this is happening now, first the US Dollar, here is the 1-year performance of the U.S. Dollar mapped,

Continue reading “History is repeating itself, is this the end of the current cycle of global synchronised growth?”

Euro Area or Eurozone Money Velocity seems to be shockingly low

We couldn’t find any official Money Velocity numbers for the Euro Area (Eurozone) so calculated it using the Equation of Exchange

Equation of Exchange

MV=PQ

Money Supply (M) * Money Velocity (V) = Price level (P) * Real economic output (Q)

Which means Money Supply * Money Velocity = Nominal GDP

Therefore, Money Velocity = Nominal GDP/Money Supply

We have the numbers for both Money Supply (from OECD – Organization for Economic Co-operation and Development) and Nominal GDP (from Eurostat) for the Euro Area.

Continue reading “Euro Area or Eurozone Money Velocity seems to be shockingly low”

Eurozone Q2 2018 GDP up by 0.3% and European Union Q2 2018 GDP up by 0.4% as Household saving rate falls to the lowest in over a decade

Seasonally adjusted GDP rose by 0.3% in the Eurozone and by 0.4% in the European Union (EU28) during the second quarter (Q2) of 2018, compared with the previous quarter, according to a preliminary flash estimate published by Eurostat, the statistical office of the European Union.

EU GDP until Q2 2018 chart
Source: Eurostat

Continue reading “Eurozone Q2 2018 GDP up by 0.3% and European Union Q2 2018 GDP up by 0.4% as Household saving rate falls to the lowest in over a decade”