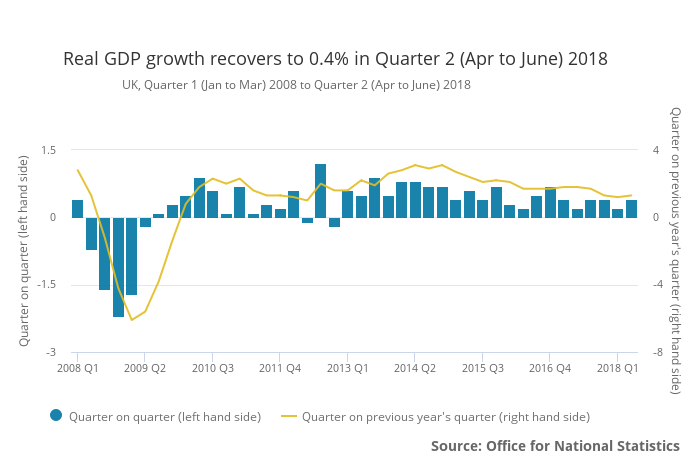
UK GDP in volume terms was estimated to have increased by 0.4% between Q1 2018 and Q2 2018. GDP rose by 1.3% in Q2 2018 compared with the same quarter a year ago.
Why wouldn’t it be?
UK GDP in volume terms was estimated to have increased by 0.4% between Q1 2018 and Q2 2018. GDP rose by 1.3% in Q2 2018 compared with the same quarter a year ago.
We couldn’t find any official Money Velocity numbers for the Euro Area (Eurozone) so calculated it using the Equation of Exchange
Equation of Exchange
MV=PQ
Money Supply (M) * Money Velocity (V) = Price level (P) * Real economic output (Q)
Which means Money Supply * Money Velocity = Nominal GDP
Therefore, Money Velocity = Nominal GDP/Money Supply
We have the numbers for both Money Supply (from OECD – Organization for Economic Co-operation and Development) and Nominal GDP (from Eurostat) for the Euro Area.
Continue reading “Euro Area or Eurozone Money Velocity seems to be shockingly low”
U.S. 2-year, 3-year, 5-year, 7-year, 10-year, 20-year and 30-year yields are all converging. Looks like a beautiful chart, just one thing …
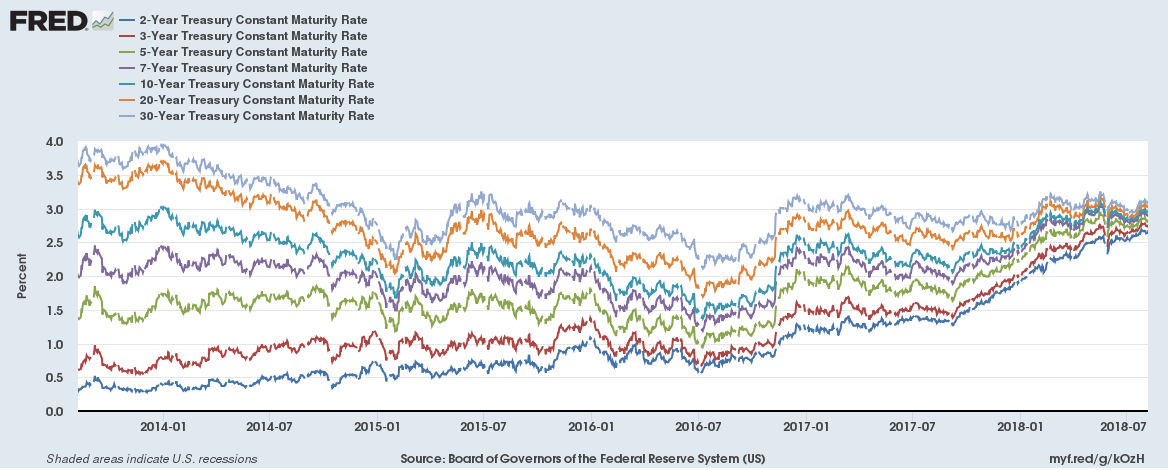
Continue reading “The great U.S. Government bond yield convergence chart”
Is China selling U.S Government Bonds (Treasury Bills, T-Bonds and Notes) given the trade war tensions between China and the United States? The simple answer to that is no. Actually, no major foreign country holder of bonds is really selling.
But you might wonder what is going on if you make a chart look like this,
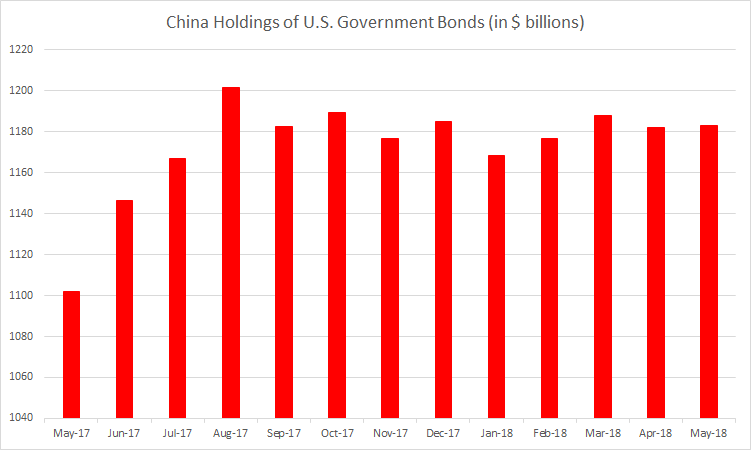
Continue reading “China hasn’t been selling U.S. Government Bonds despite trade tensions”
We will be publishing a number of statistics for the United Kingdom (and the European Union) over the next few days in the run up to a major piece we will be publishing on the real economics of Brexit.
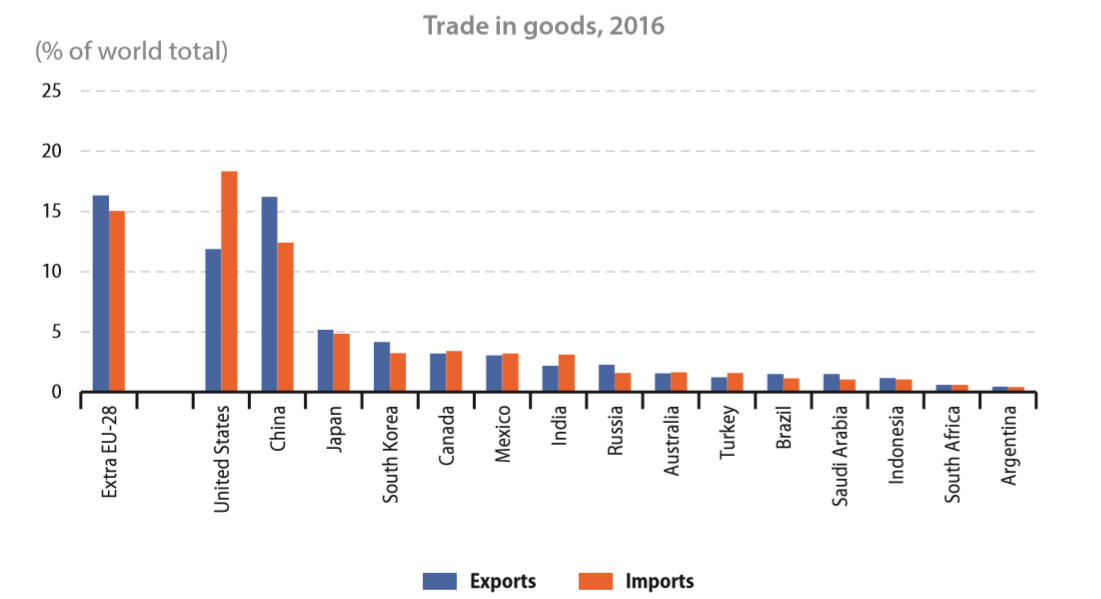
The European Union (EU28 or EU) accounted for around one sixth of world trade in goods in 2016, with a 16.3% share of exports and a 15.0% share of imports. Turning to services the EU28’s contribution to world trade (mainly due to the United Kingdom which is leaving the European Union) was even greater, totalling 24.7% of exports and 21.1% of imports.
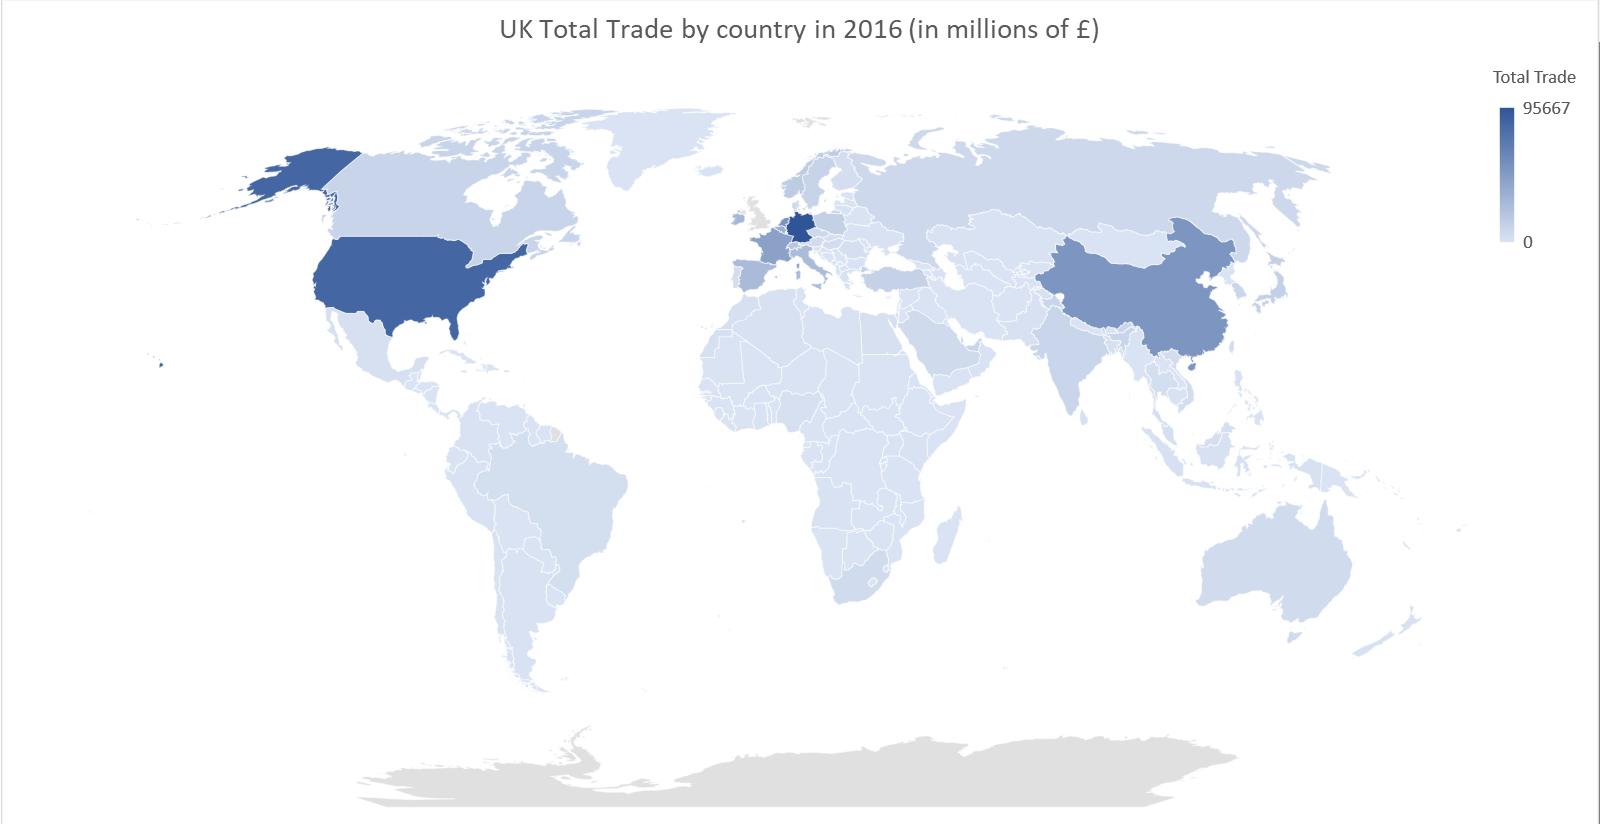
We will be publishing a number of statistics for the United Kingdom over the next few days in the run up to a major piece we will be publishing on the real economics of Brexit. In the meanwhile, here are trade statistics for the United Kingdom for 2016 (the latest full year of data available) sourced from the Office for National Statistics.
The top 5 countries for total trade value were Germany (£95.67 billion), the United States (£84.09 billion), the Netherlands (£53.93 billion), China (£52.51 billion) and France (£44.40 billion)
Continue reading “UK Trade Statistics for trade by each country”
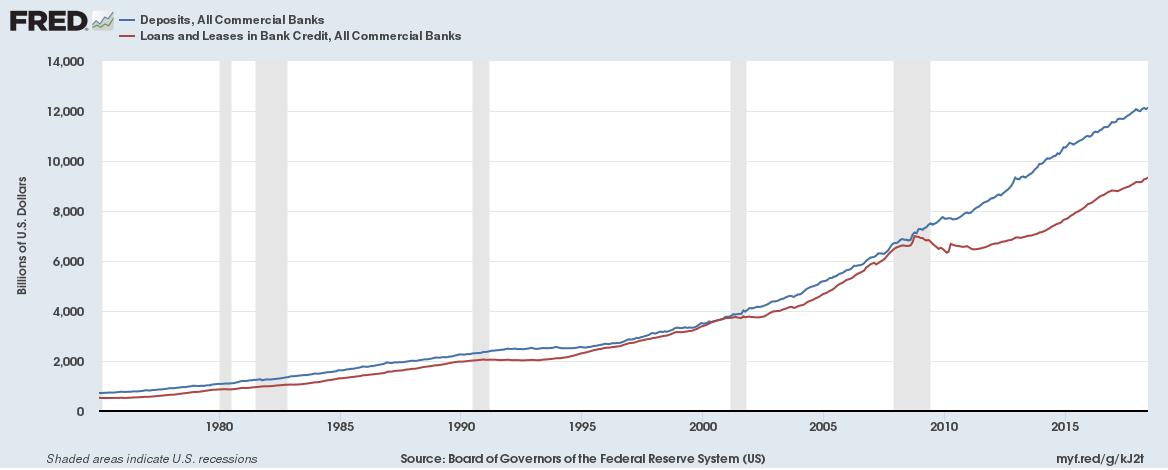
Since the financial crisis of 2008-2009 the difference between bank deposit growth and bank loan growth in the U.S. diverged in a big way, graph below,
Here are highlights from July 2018,
Our three most read posts in July 2018
Do economic fundamentals matter anymore?
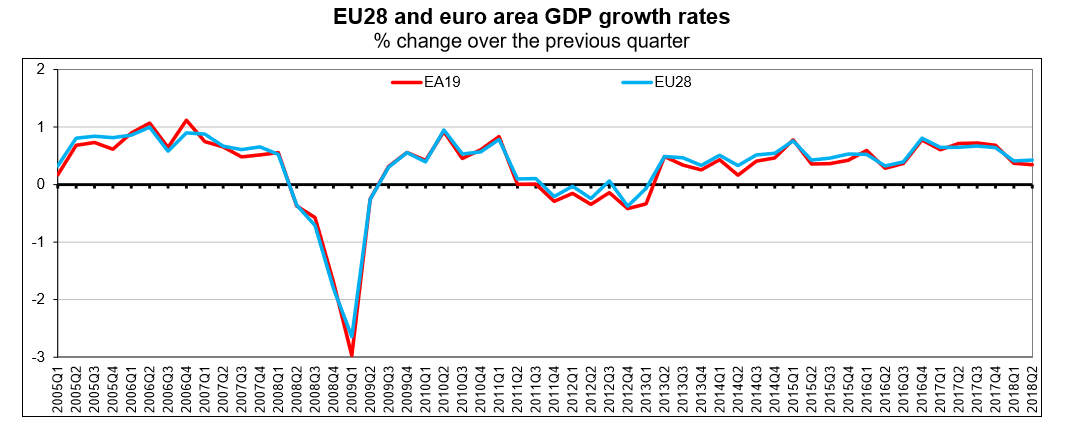
Seasonally adjusted GDP rose by 0.3% in the Eurozone and by 0.4% in the European Union (EU28) during the second quarter (Q2) of 2018, compared with the previous quarter, according to a preliminary flash estimate published by Eurostat, the statistical office of the European Union.
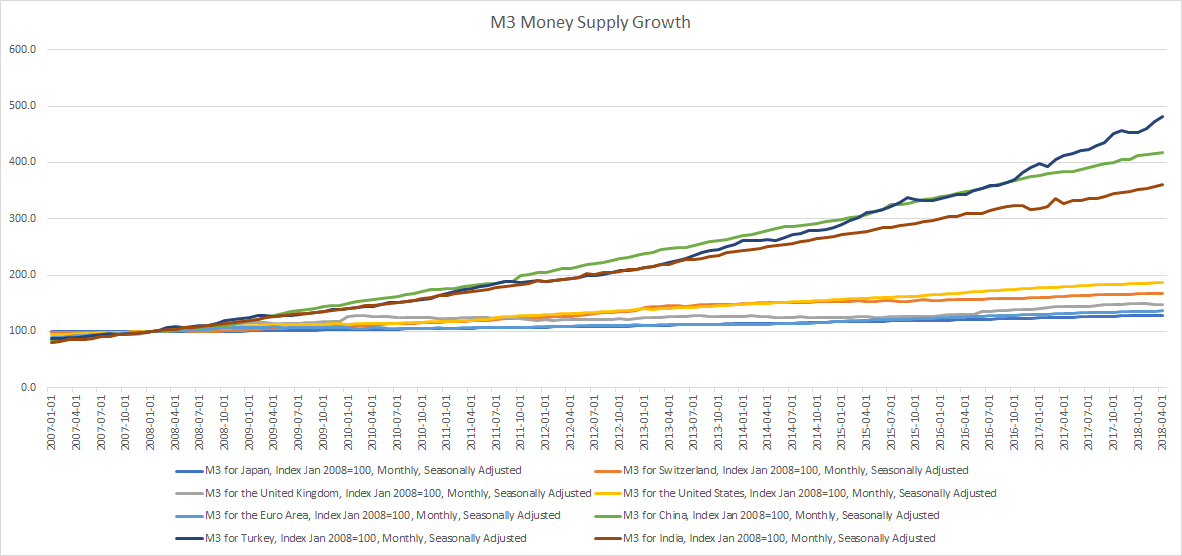
Broad Money M3
Broad money (M3) includes currency, deposits with an agreed maturity of up to two years, deposits redeemable at notice of up to three months and repurchase agreements, money market fund shares/units and debt securities up to two years.