The U.S. economy is doing great and is set to contribute 25% of global Gross Domestic Product (GDP) this year, its highest share since 2007. The rise of the U.S. dollar and increases in interest rates are squeezing emerging economics at an unprecedent pace. But it isn’t just emerging economies that are feeling the squeeze, Europe has its problems with Italian debt (and yields), the Australian dollar which has long been considered a growth asset has been falling this year and elsewhere trade worries and rising oil prices are having a big impact on other nations. Even German factory orders are the weakest in years as the U.S. is truly taking back economic leadership.
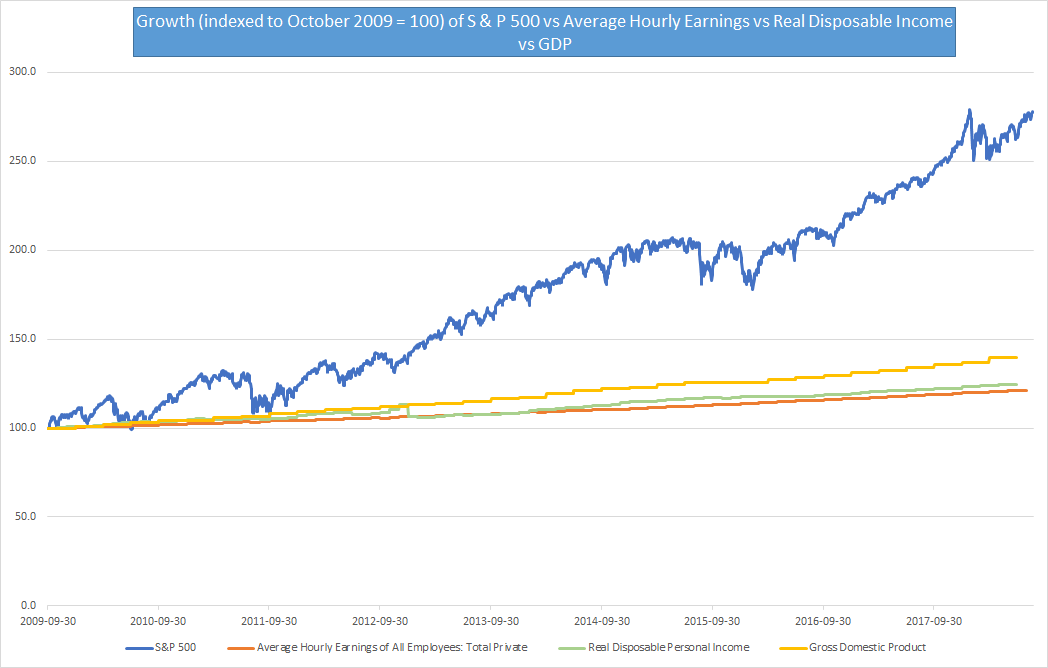
The S & P 500 is up 180% since the end of the last U.S. recession but the average wage is only up 21.2%, disposable income up 24.6% and GDP up 39.5%
The S & P 500 has had a stellar run of nine and a half years of gains closing at a new high in the week gone by. It is up 300% since the 9th of March 2009 when it hit a multi-year low in the aftermath of the financial crisis. Even considering the time post the end of the last U.S. recession, the S & P 500 has outperformed every major financial metric by a big margin.
U.S. Trade Statistics for January to June 2018 – exports up 9.67% as imports up 8.66%, EU largest trade partner, China replaces Canada as second largest trade partner
U.S. trade with the world has grown despite tariffs and tariffs rhetoric in the first half (January to June) of 2018. There is one point of view that trade grew to avoid tariffs before they were implemented which might be partially true. Here are the key takeaways and the dataset,
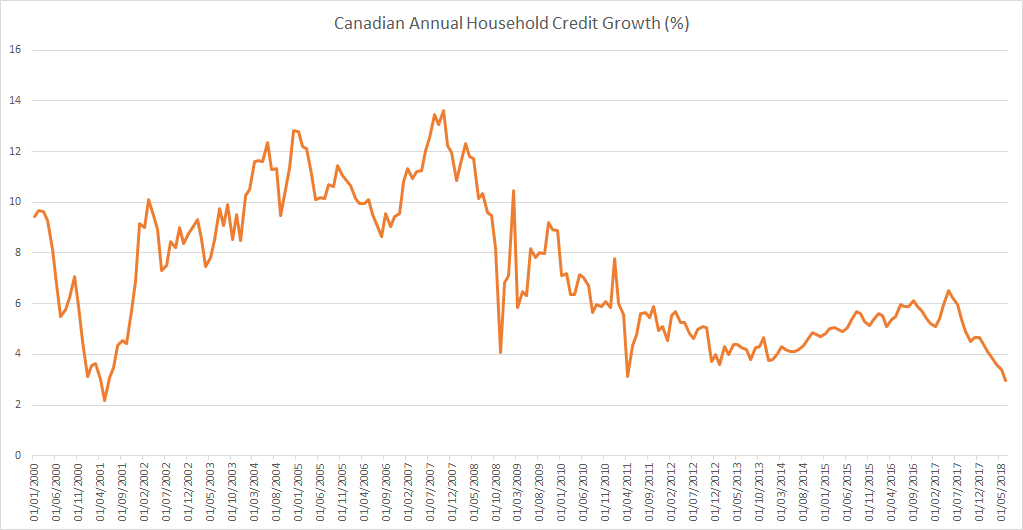
Canadian household credit growth is slowest since 2001 but individual debt is already 175 percent of disposable income
Canadian household credit growth is slowest since 2001 with Household credit (Annualized 3-month growth rate) growing at 2.98% and Household Mortgage credit (Annualized 3-month growth rate) growing at 2.85%.
London house prices have fallen most since 2009 but it is not what it seems
The media has recently been writing about an apparent house price crash for UK house prices but it isn’t that bad. We wrote in May that UK house sales and house price growth are slowing, the on the ground situation hasn’t changed since and the newly available statistics support that.
Continue reading “London house prices have fallen most since 2009 but it is not what it seems”
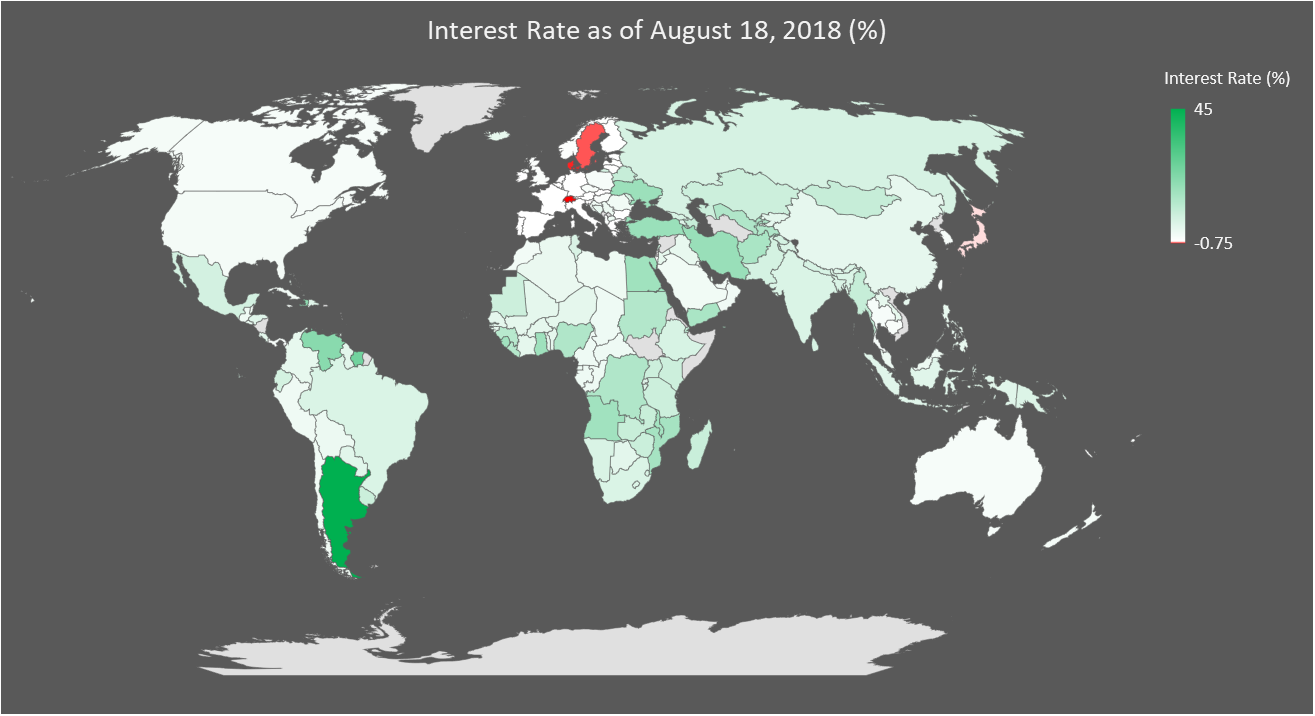
Interest Rates globally are changing at the fastest pace ever
Interest Rates globally are changing (in both directions) at the fastest pace ever in the history of the modern central banking system. Nearly half of the countries in the world have cut interest rates while the other half have hiked them in the past 6 months. The average change for countries with a change in interest rate has been +0.22% in the past 6 months. Take Argentina and Turkey out and the average (global) interest rate has actually fallen.
Continue reading “Interest Rates globally are changing at the fastest pace ever”
Past, present, future – some demographic and economic statistics for the European Union
We will be publishing a number of statistics for the United Kingdom (and the European Union) over the next few days in the run up to a major piece we will be publishing on the real economics of Brexit.
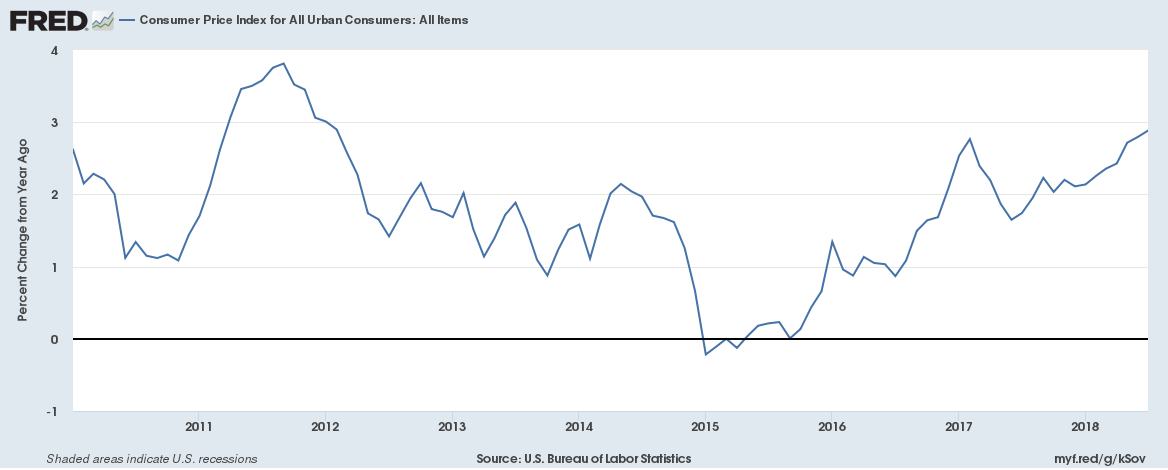
U.S. Inflation at 2.9% is the highest since February 2012 and has outstripped wage growth for the first time since October 2012
U.S. Consumer Inflation at 2.9% is the highest since February 2012. And it isn’t just energy prices causing inflation to soar. Core inflation (which is Consumer inflation excluding volatile energy and food prices) at 2.4% has risen at the fastest pace in a decade. Here is a chart for CPI inflation growth,
Here’s how you can get updates by email for new posts on this site
We don’t have an email mailing list or email subscription facility currently because we simply do not want to hold any user data due to global data protection laws. But there are ways to receive updates for new posts on this site.
Continue reading “Here’s how you can get updates by email for new posts on this site”
History is repeating itself, is this the end of the current cycle of global synchronised growth?
We wrote earlier this year on the downsides of synchronised global growth. We wrote that when global synchronised growth begins to end the U.S. dollar strengthens, investors run away from emerging markets, interest rates continue to rise to tame inflation and bad debt becomes an issue. All of this is happening now, first the US Dollar, here is the 1-year performance of the U.S. Dollar mapped,