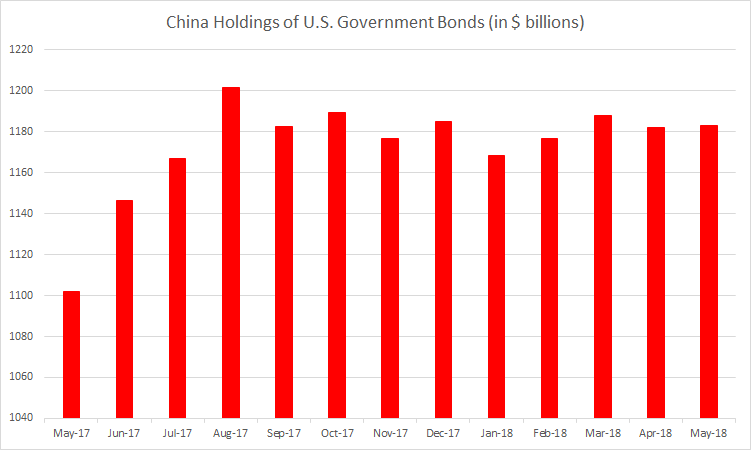
Is China selling U.S Government Bonds (Treasury Bills, T-Bonds and Notes) given the trade war tensions between China and the United States? The simple answer to that is no. Actually, no major foreign country holder of bonds is really selling.
But you might wonder what is going on if you make a chart look like this,
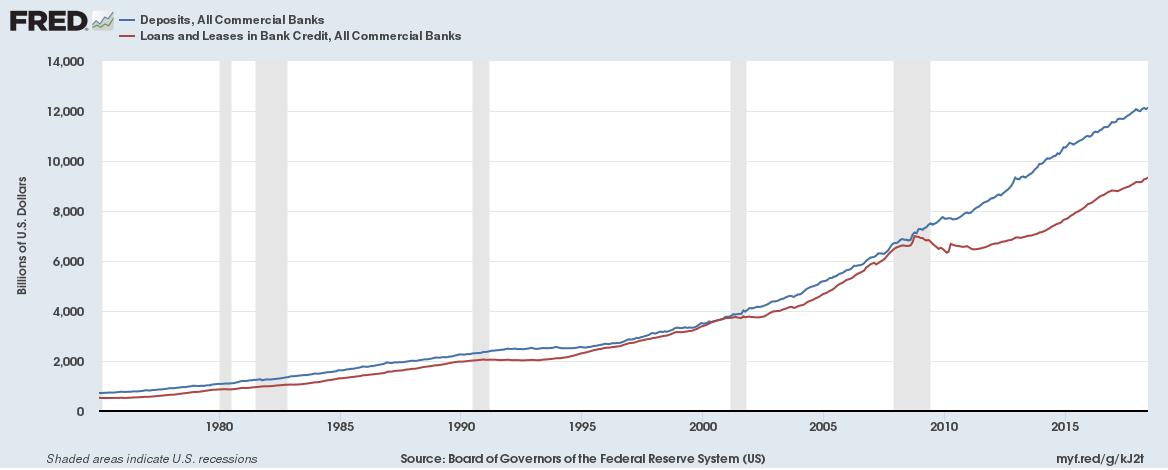
Since the financial crisis of 2008-2009 the difference between bank deposit growth and bank loan growth in the U.S. diverged in a big way, graph below,
Source: Board of Governors of the Federal Reserve System (US)
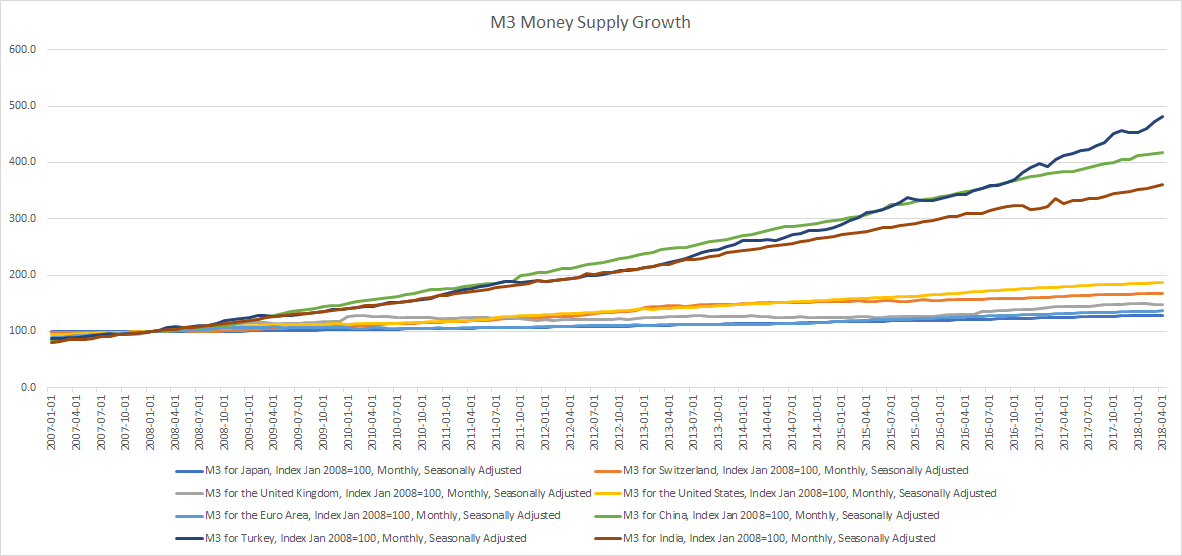
Broad money (M3) includes currency, deposits with an agreed maturity of up to two years, deposits redeemable at notice of up to three months and repurchase agreements, money market fund shares/units and debt securities up to two years.
Source: Organization for Economic Co-operation and Development
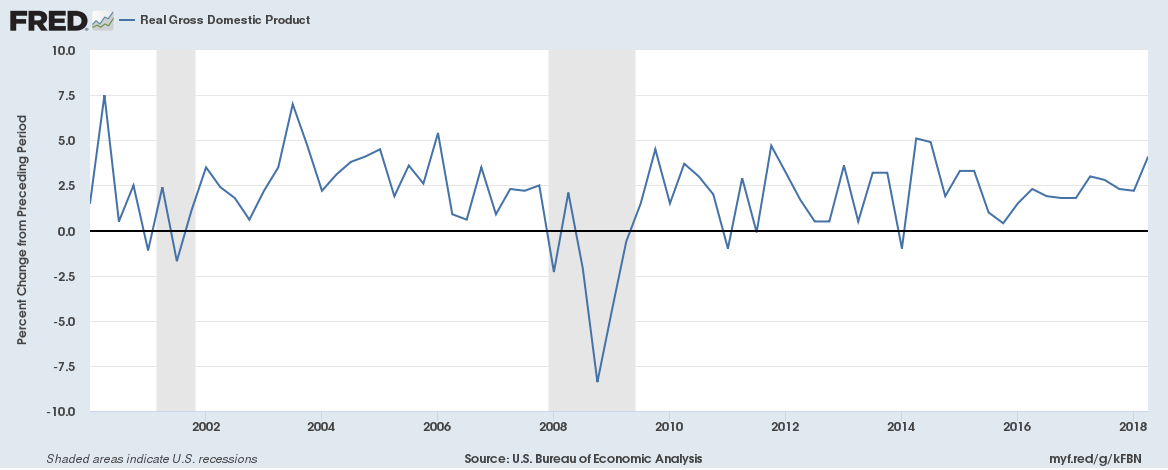
Real gross domestic product for the United States increased at an annual rate of 4.1% in Q2 2018 according to the advance estimate released by the Bureau of Economic Analysis.
The first estimate for the European Union exports of goods in May 2018 was €160.9 billion, down by 2.7% compared with May 2017 (€165.4 bn). Imports from the rest of the world stood at €160.7 bn, down by 1.4% compared with May 2017 (€163.0 bn). As a result, the European Union recorded a €0.2 bn surplus in trade in goods with the rest of the world in May 2018, compared with a surplus of €2.3 bn in May 2017. Intra-European Union trade rose to €294.7 bn in May 2018, +1.6% compared with May 2017.
In January to May 2018, the European Union exports of goods rose to €786.6 bn (an increase of 1.5% compared with January-May 2017), while imports rose to €795.7 bn (an increase of 1.6% compared with January-May 2017). As a result, the European Union recorded a deficit of €9.1 bn, compared with a deficit of €8.1 bn in January-May 2017. Intra-European Union trade rose to €1457.3 bn in January-May 2018, +4.6% compared with January-May 2017.
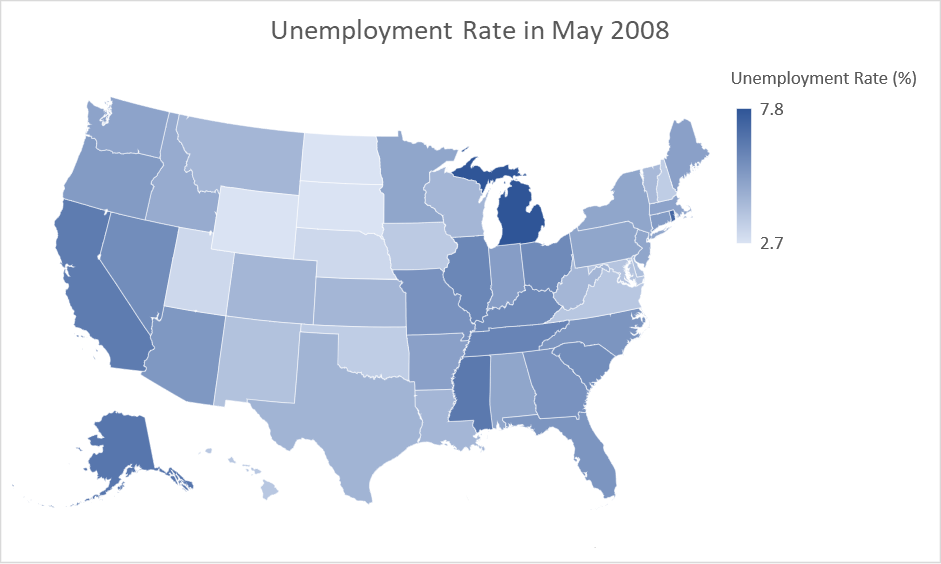
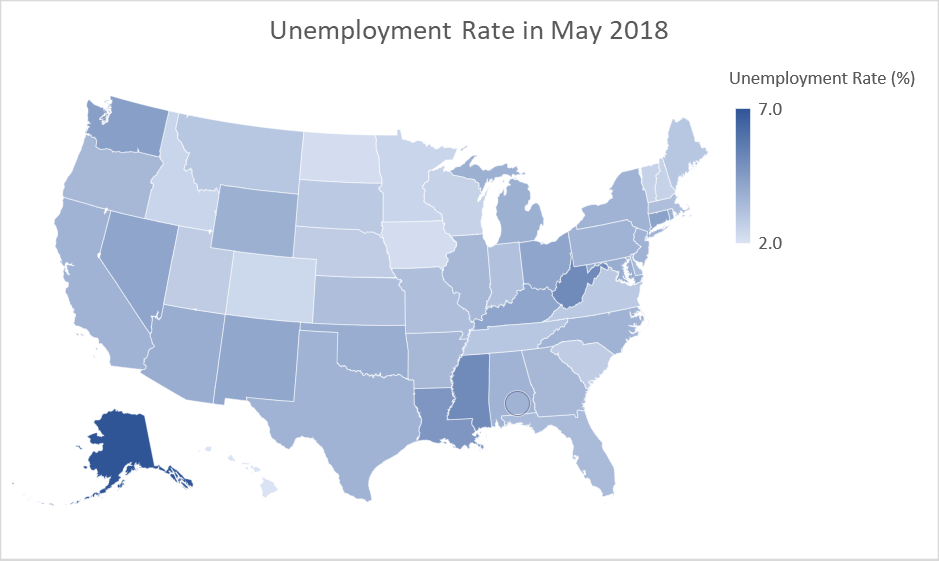
Some states in the United States have done exceptionally well over the past decade creating massive number of new jobs and reporting record low unemployment. There are reports of major labour shortages in at least some states currently.
Here are maps of the unemployment rate in each state in May 2008 and May 2018,
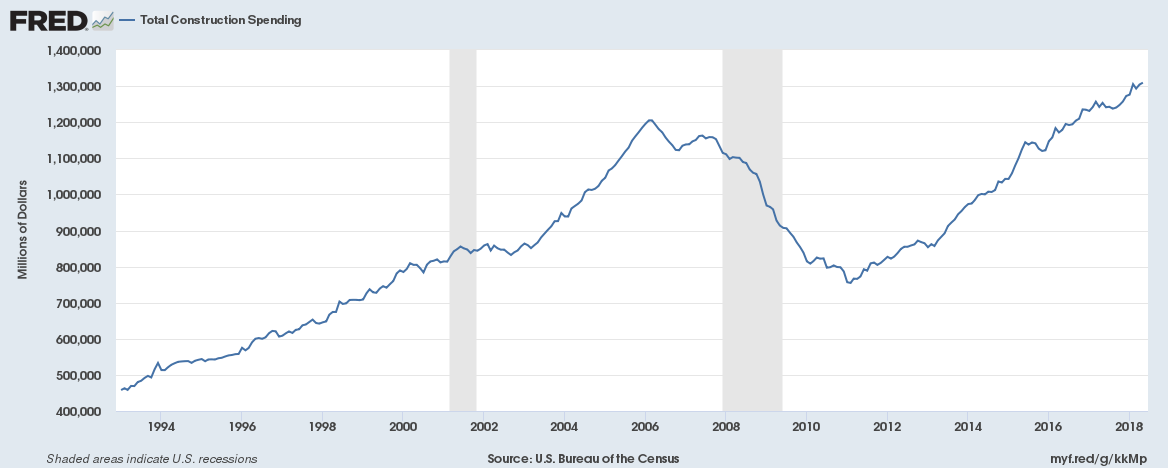
Both residential and non-residential construction spending continue to grow in the United States. Total construction spending for May 2018 was an annualized $1.31 trillion, up from $1.25 trillion in May 2018.