Has Gold, U.S. Equities or U.S. Property performed the best? We compare the performance of each and the results are surprising.
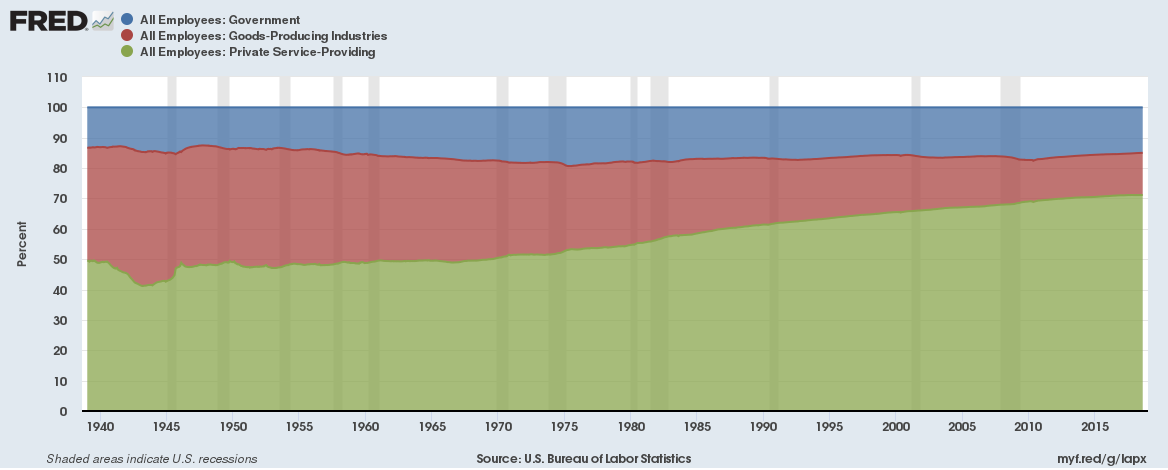
The Service sector increasingly dominates the U.S. labour market
The private service sector in the United States now accounts for over 71% of all jobs given the growth in entertainment, tourism, healthcare and educational services. The exponential growth of the internet and people buying more experiences (like travelling or eating out) rather than buying goods means the goods-producing industries (like construction, manufacturing and mining) have seen a decline in jobs and now contribute less than 14% of all jobs. Government jobs have contributed around 15% consistently to the overall labour market over the past 50 years.
Continue reading “The Service sector increasingly dominates the U.S. labour market”
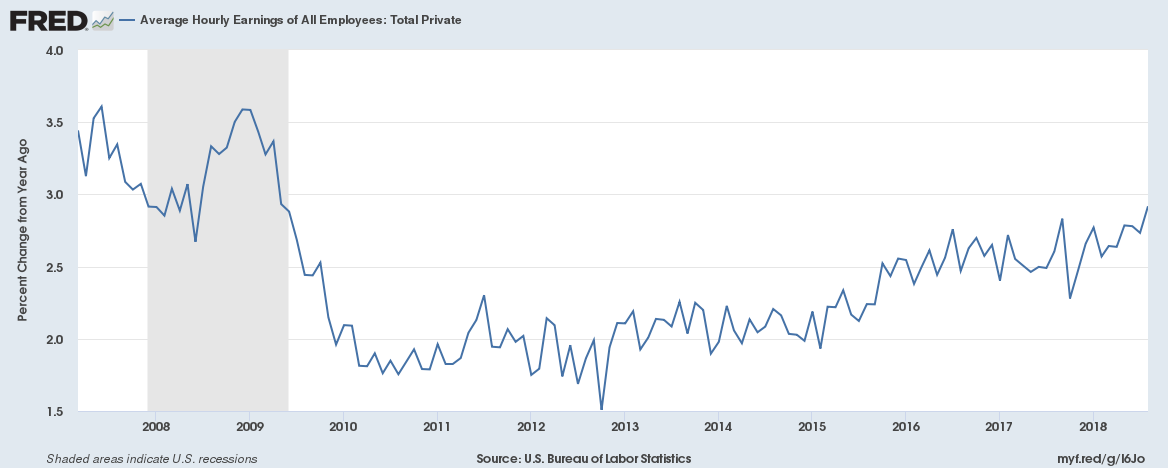
Here’s why wages aren’t rising despite record employment and labour shortages
Both the United Kingdom and the United States currently have record multi-year high levels of employment, yet wages haven’t kept up with inflation for the vast majority of people causing a real income squeeze. Although the U.S. recently reported the highest wage growth since the last recession most people don’t feel their wages are keeping up with rising prices. What is going on?
Continue reading “Here’s why wages aren’t rising despite record employment and labour shortages”
Currency carnage everywhere, here’s how every currency in the world has performed against the US dollar over the past year
What a difference six months makes, here’s the performance of the US dollar against each currency as of the 5th of September 2018,
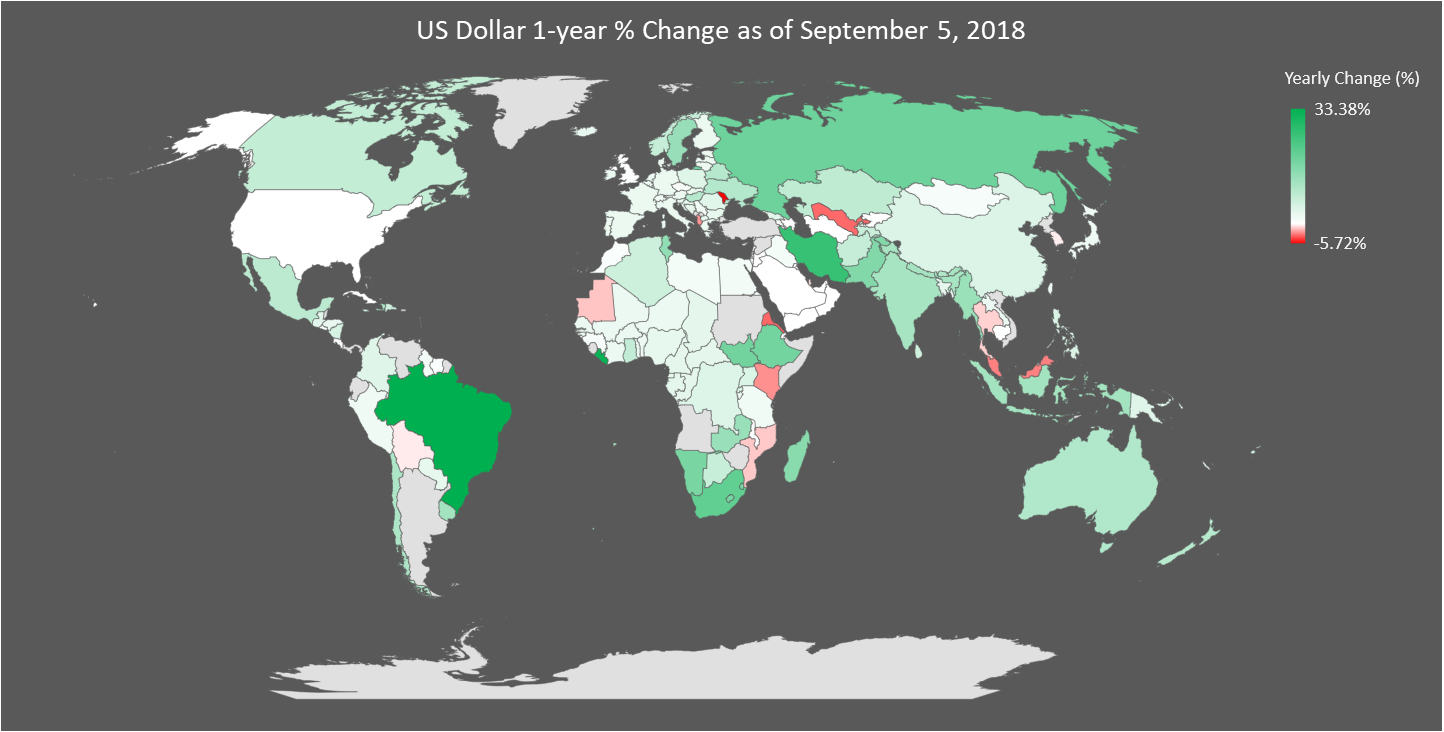
Notes: 1. We have excluded the performance of Angola, Sudan, Argentina, Turkey and Venezuela on the map because they are major outliers. They are included in the data set below. 2. Currency price data updated 05-September-2018
Do nations with balance of payments or trade surpluses really outperform those with deficits?
Does a balance of payment (or trade) surplus equate higher growth? Not necessarily, Australia which has had deficits for over forty years has grown faster than Germany which has had over forty years of surpluses. Does a current account surplus (i.e. exports greater than imports) mean a nation is doing better than other nations with current account deficits? The answer is no, what really matters is why the deficits exist.
The U.S. economy is set to contribute its highest share of global GDP since 2007 as other economies everywhere else stumble
The U.S. economy is doing great and is set to contribute 25% of global Gross Domestic Product (GDP) this year, its highest share since 2007. The rise of the U.S. dollar and increases in interest rates are squeezing emerging economics at an unprecedent pace. But it isn’t just emerging economies that are feeling the squeeze, Europe has its problems with Italian debt (and yields), the Australian dollar which has long been considered a growth asset has been falling this year and elsewhere trade worries and rising oil prices are having a big impact on other nations. Even German factory orders are the weakest in years as the U.S. is truly taking back economic leadership.
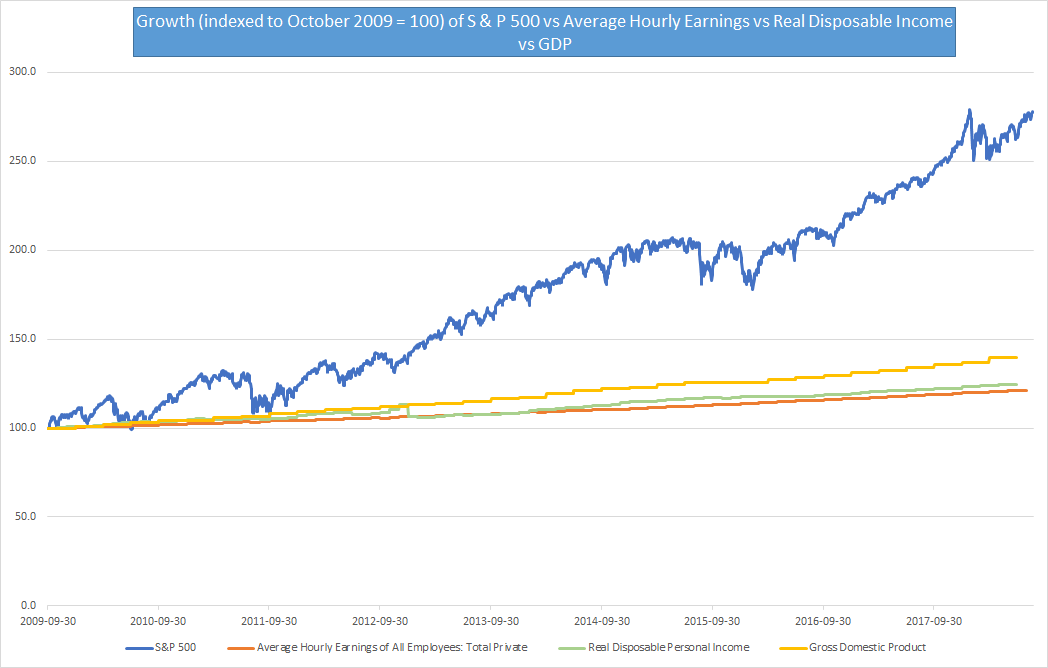
The S & P 500 is up 180% since the end of the last U.S. recession but the average wage is only up 21.2%, disposable income up 24.6% and GDP up 39.5%
The S & P 500 has had a stellar run of nine and a half years of gains closing at a new high in the week gone by. It is up 300% since the 9th of March 2009 when it hit a multi-year low in the aftermath of the financial crisis. Even considering the time post the end of the last U.S. recession, the S & P 500 has outperformed every major financial metric by a big margin.
U.S. Trade Statistics for January to June 2018 – exports up 9.67% as imports up 8.66%, EU largest trade partner, China replaces Canada as second largest trade partner
U.S. trade with the world has grown despite tariffs and tariffs rhetoric in the first half (January to June) of 2018. There is one point of view that trade grew to avoid tariffs before they were implemented which might be partially true. Here are the key takeaways and the dataset,
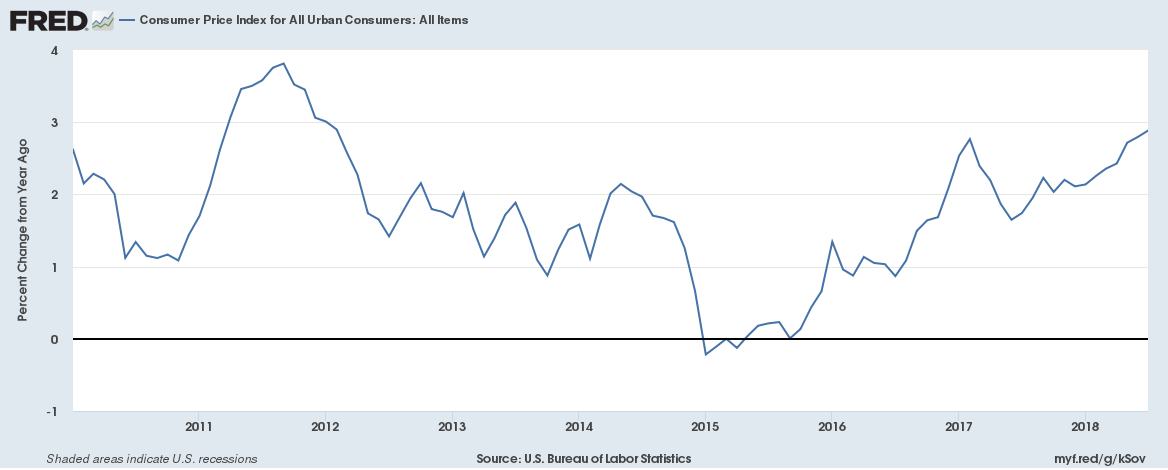
U.S. Inflation at 2.9% is the highest since February 2012 and has outstripped wage growth for the first time since October 2012
U.S. Consumer Inflation at 2.9% is the highest since February 2012. And it isn’t just energy prices causing inflation to soar. Core inflation (which is Consumer inflation excluding volatile energy and food prices) at 2.4% has risen at the fastest pace in a decade. Here is a chart for CPI inflation growth,
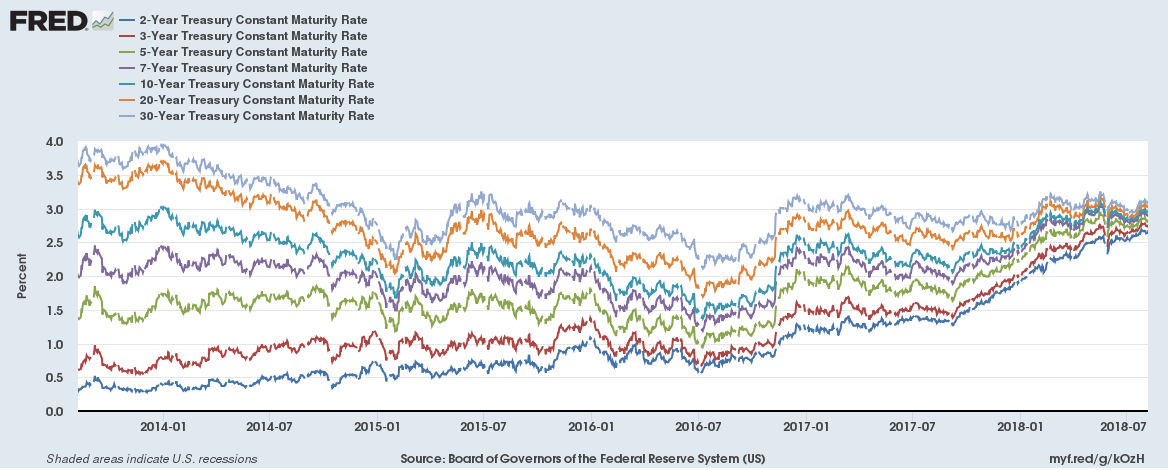
The great U.S. Government bond yield convergence chart
U.S. 2-year, 3-year, 5-year, 7-year, 10-year, 20-year and 30-year yields are all converging. Looks like a beautiful chart, just one thing …
Continue reading “The great U.S. Government bond yield convergence chart”