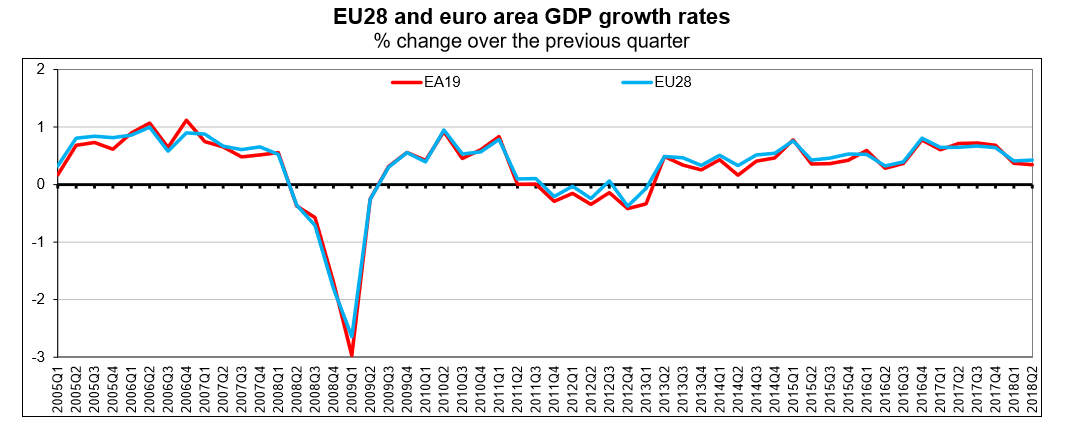
Seasonally adjusted GDP rose by 0.3% in the Eurozone and by 0.4% in the European Union (EU28) during the second quarter (Q2) of 2018, compared with the previous quarter, according to a preliminary flash estimate published by Eurostat, the statistical office of the European Union.
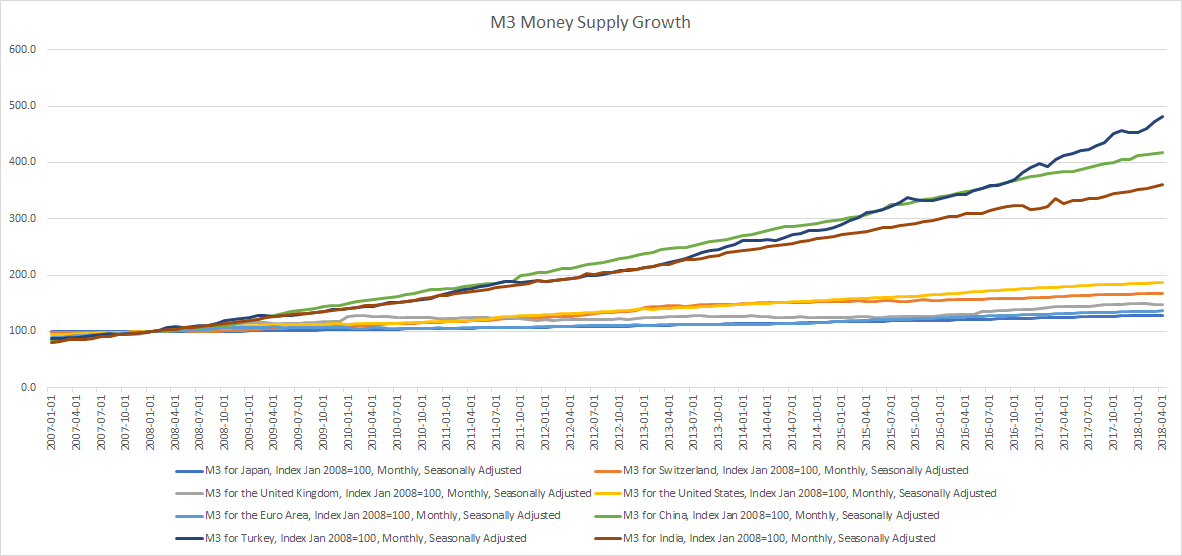
Broad money (M3) includes currency, deposits with an agreed maturity of up to two years, deposits redeemable at notice of up to three months and repurchase agreements, money market fund shares/units and debt securities up to two years.
Source: Organization for Economic Co-operation and Development
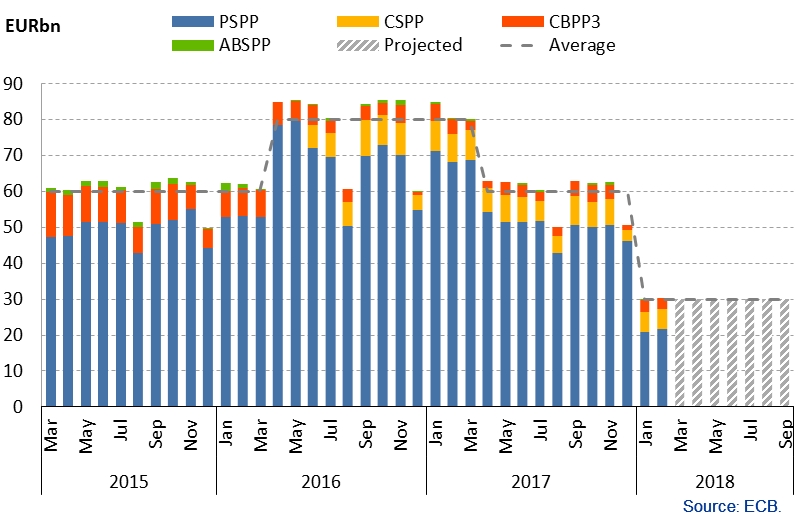
The European Central Bank (ECB) announced on Wednesday that it will halve its bond buys to 15 billion Euros (from the current 30 billion Euros) a month from October then shut the programme at the end of the year.
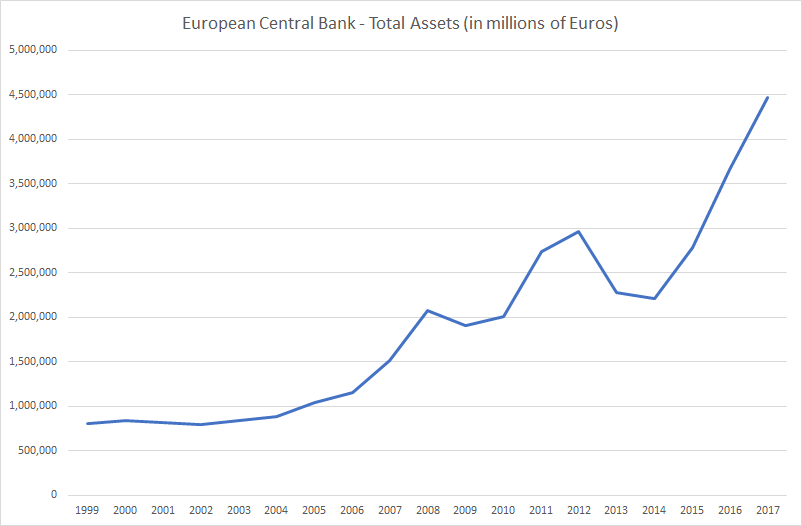
Source: European Central Bank
ECB’s balance sheet has increased by 2 trillion Euros since 2015 when it announced its bond buying programme. 2-year yields for most of the Eurozone countries are currently negative and 10-year yields in most cases are lower than that of the United States. The European Central Bank (ECB) is by far the biggest holder of European bonds and the biggest (almost 90%) buyer of the weaker Eurozone (Italy, Spain, Portugal and Greece) countries debt since 2015. The ECB balance sheet is now over 4.5 trillion Euros, some 45% of Eurozone GDP.
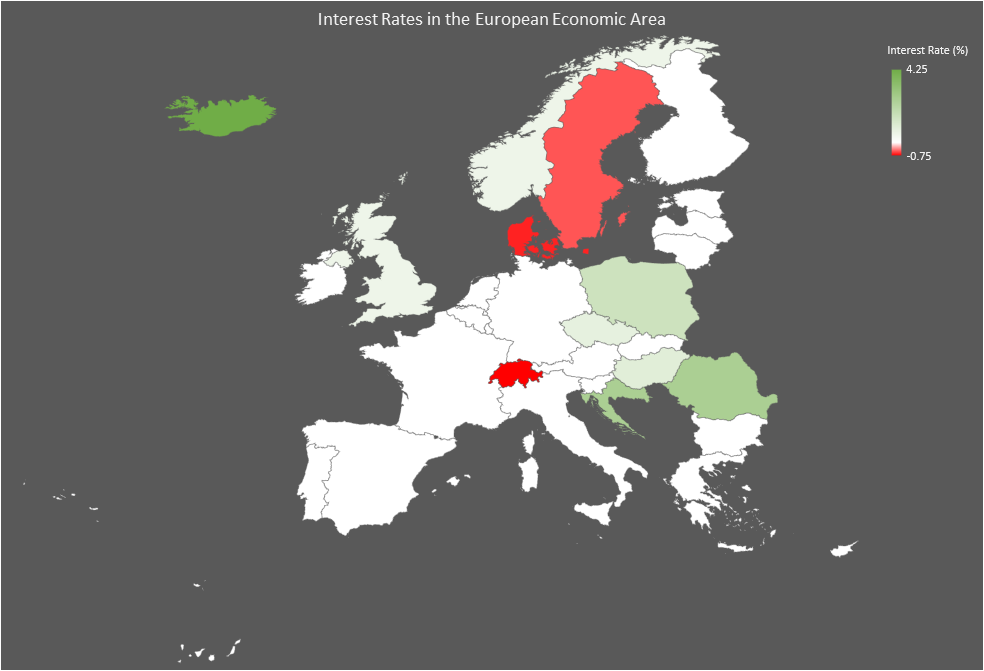
Here are the base interest rates for countries in the European Union plus additionally those in the European Economic Area and Switzerland (as of June 5, 2018),
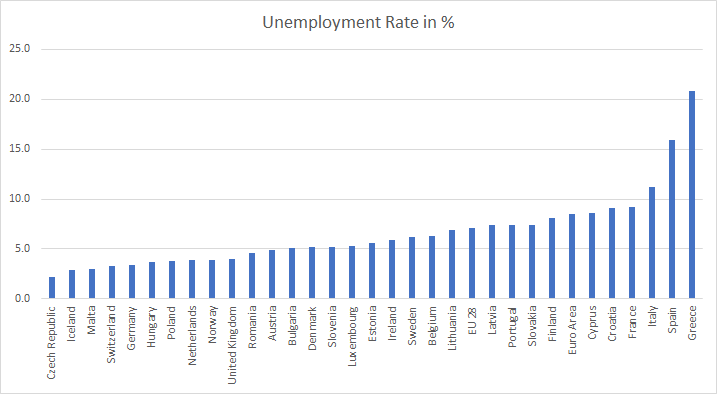
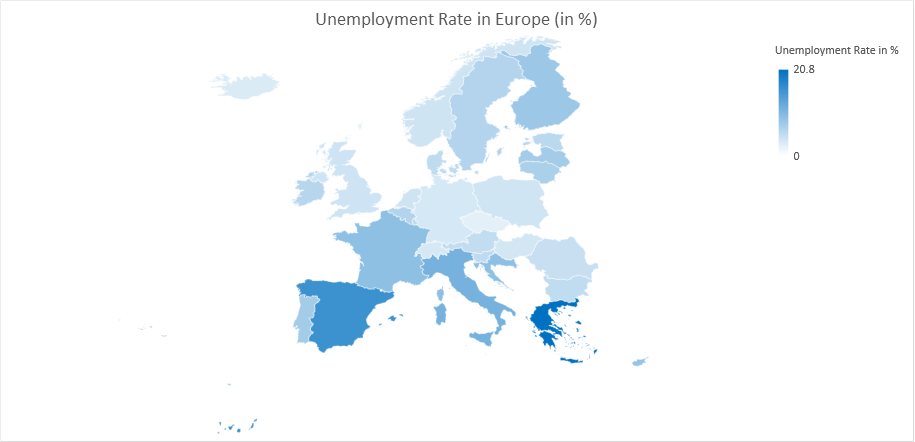
The Euro Area unemployment rate was 8.5% in April 2018, down from 8.6% in March 2018 and from 9.2% in April 2017. This is the lowest since December 2008 but still more than double of the US unemployment rate of 3.9% reported in April (the US unemployment rate further fell to 3.8% in May). The EU28 unemployment rate was 7.1% in April 2018, stable compared with March 2018 and down from 7.8% in April 2017. This remains the lowest rate recorded in the EU28 since September 2008.
Data Source: Eurostat (for the European Union and Iceland), State Secretariat for Economic Affairs (for Switzerland), Office for National Statistics (for the United Kingdom)Data Source: Eurostat (for the European Union and Iceland), State Secretariat for Economic Affairs (for Switzerland), Office for National Statistics (for the United Kingdom)
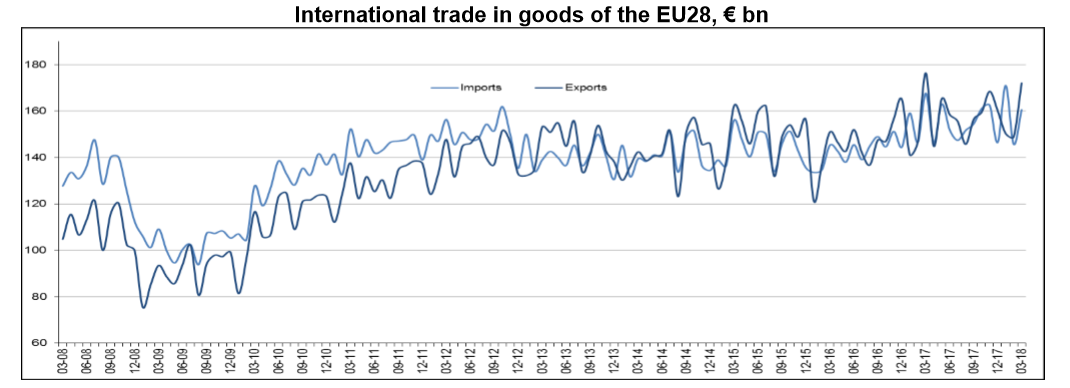
The total trade surplus for the European Union increased from €15.6 bn in Q1 2017 to €19.1 bn in Q1 2018, total exports were €1.34 trillion and total imports were €1.33 trillion
10 of the 28 European Union countries had a trade surplus in Q1 2018 and 18 had a trade deficit
Germany had the largest trade surplus in Q1 2018 at €62.2 bn, Netherlands at €15.8 bn and Ireland at €12.4 bn
The United Kingdom had the largest trade deficit in Q1 2018 at €41.1 bn, France at €21.2 bn and Spain at €7.9 bn
Parts of the European Union have seen GDP per capita shrink between 2007 and 2017 and the overall compounded annual growth rate for the European Union was just 1.2%
GDP growth for the European Union between 2007 and 2017 adjusted for inflation was negative
Banks in Greece, Cyprus, Portugal and Italy have a non-performing loan ratio of over 10% a decade on from the financial crisis and have only provisioned around 50% of the losses
The European Central Bank (ECB) is by far the biggest holder of European bonds and has a balance sheet of €4.5 trillion or some 45% of the GDP of the Eurozone
18 of the 28 countries that are part of the European Union have seen house prices fall between 2008 and 2017
Greece has been the worst affected country, with its stock market down 85% since 2007, GDP per capita down 22% since 2007, house prices down 43% since 2008 and banks in Greece currently have a non-performing loan ratio of 42%
Eurozone Debt as % of GDP is gradually falling but is still historically high
Since the financial crisis of 2008, economic uncertainty has seen falling fertility rates for the European Union with population now set to fall over the coming decades
Hidden away in the European Central Bank’s supervisory and prudential statistics are metrics for asset quality. It isn’t easy to find and if you do find them then the spreadsheets won’t open without issues. Once If you manage to get them to work you will find some quite stunning statistics.
The European Central Bank (ECB) is by far the biggest holder of European bonds and the biggest (possibly the only) buyer of the weaker Eurozone (Italy, Spain, Portugal and Greece) countries debt.
Asset purchase programme monthly net purchases, source ECB