Here’s how the European Central Bank or ECB could unwind or reduce its balance sheet plus what is the new normal for the ECB?

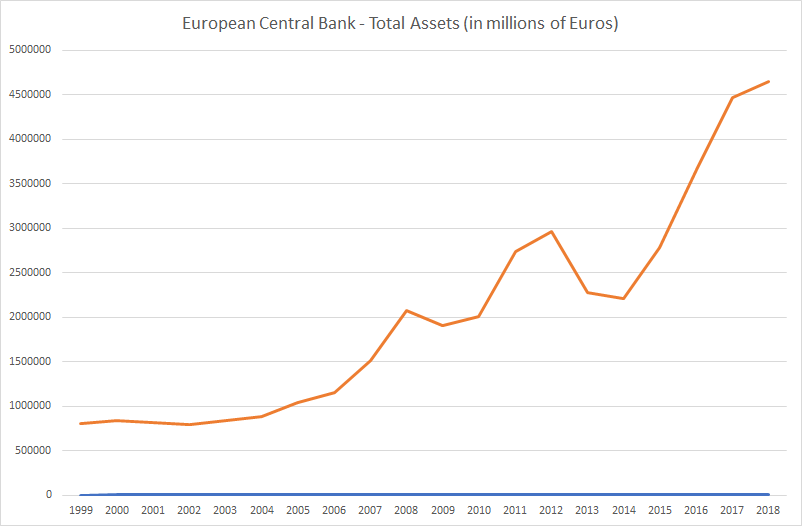
The European Central Bank (ECB) only started its Quantitative Easing (or QE) program in March 2015 in order to fight ultralow inflation in the Eurozone (also called the Euro Area). It somewhat worked by weakening the Euro (€), increasing exports, giving the stock market a boost and drastically lowering financing costs for European governments and corporations. This caused the ECB balance sheet to soar over €4.5 trillion or 45% of Eurozone GDP.

ECB Balance Sheet until November 2018
Data Source: ECB

Continue reading “Here’s how the European Central Bank or ECB could unwind or reduce its balance sheet plus what is the new normal for the ECB?”

Eurozone and European Union trade stats for January to September 2018; EU trade surplus with the U.S. up 18% year on year as trade deficit with Russia up 38% year on year

In January to September 2018, Euro area or Eurozone exports of goods to the rest of the world rose to €1,686.0 bn (an increase of 3.6% compared with January to September 2017), while imports rose to €1,542.9 bn (an increase of 5.8% compared with January to September 2017). As a result, the euro area recorded a surplus of €143.1 bn, compared with +€169.2 bn in January-September 2017. Intra-euro area trade rose to €1,449.8 bn in January-September 2018, up by 5.7% compared with January-September 2017.

Euro Area trade until September 2018 graph
Source: Eurostat

Continue reading “Eurozone and European Union trade stats for January to September 2018; EU trade surplus with the U.S. up 18% year on year as trade deficit with Russia up 38% year on year”

Germany Q3 2018 GDP shrank 0.2% on the previous quarter (worst since 2015), did Eurozone really grow 0.2%?

The Federal Statistical Office (Destatis) reported that the German GDP shrank by 0.2% in the third quarter (vs the second quarter) of 2018. Growth was +1.1% on the same quarter a year earlier following increases of 2.3% in the second quarter (calendar adjusted: +2.0%) and 1.4% in the first quarter of 2018 (calendar adjusted: +2.1%).

German Q3 2018 GDP

Continue reading “Germany Q3 2018 GDP shrank 0.2% on the previous quarter (worst since 2015), did Eurozone really grow 0.2%?”

Eurozone Q3 2018 GDP up by 0.2% and European Union Q3 2018 GDP up by 0.3%, both lowest since 2013; Italy grew 0%; Eurozone economic sentiment falls for the 10th consecutive month

Seasonally adjusted GDP rose by 0.2% in the Eurozone or Euro Area and by 0.3% in the European Union (EU) during the third quarter of 2018, compared with the previous quarter, according to a preliminary flash estimate published by Eurostat, the statistical office of the European Union. In the second quarter of 2018, GDP had grown by 0.4% in the euro area and by 0.5% the European Union.

Q3 2018 GDP Eurozone and EU
Source: Eurostat

Continue reading “Eurozone Q3 2018 GDP up by 0.2% and European Union Q3 2018 GDP up by 0.3%, both lowest since 2013; Italy grew 0%; Eurozone economic sentiment falls for the 10th consecutive month”

Germany accounts for almost all the intra European Union current account surplus plus the European Union posts a record external current account surplus with the U.S.

Sixteen members of the European Union recorded current account surpluses, eleven current account deficits and one was in current account balance in the second quarter of 2018 for the total (intra-EU plus extra-EU) current account balances of the European Union (EU28) Member States.

The highest surpluses were observed in Germany (+€63.8 bn), the Netherlands (+€16.8 bn), Italy (+€10.5 bn), Ireland (+€10.2 bn) and Denmark (+€3.6), and the largest deficits in the United Kingdom (-€20.7 bn), Romania (-€2.6 bn) and Belgium (-€2.4 bn).

EU current account balance member states Q2 2018
Source: Eurostat

Continue reading “Germany accounts for almost all the intra European Union current account surplus plus the European Union posts a record external current account surplus with the U.S.”

Are major exporter countries to the United States really manipulating their currency to boost exports?

The Euro Area, China, Canada, Mexico and Japan together account for over 70% of U.S. trade. Have these countries (including the Euro Area group of countries) manipulated their currencies to boost exports? In this century (2000 onwards) the Chinese Yuan, the Canadian Dollar and the Euro have appreciated against the dollar. The Japanese Yen has been largely unchanged against the U.S. dollar since the start of this century and only the Mexican Peso has weakened against the dollar.

Continue reading “Are major exporter countries to the United States really manipulating their currency to boost exports?”

Euro Area or Eurozone Money Velocity seems to be shockingly low

We couldn’t find any official Money Velocity numbers for the Euro Area (Eurozone) so calculated it using the Equation of Exchange

Equation of Exchange

MV=PQ

Money Supply (M) * Money Velocity (V) = Price level (P) * Real economic output (Q)

Which means Money Supply * Money Velocity = Nominal GDP

Therefore, Money Velocity = Nominal GDP/Money Supply

We have the numbers for both Money Supply (from OECD – Organization for Economic Co-operation and Development) and Nominal GDP (from Eurostat) for the Euro Area.

Continue reading “Euro Area or Eurozone Money Velocity seems to be shockingly low”