Can the US government really cope with rising bond yields?

The US government has around $20.5 trillion in debt and pays around $558 billion in interest payments a year (an effective interest rate of 2.72%).

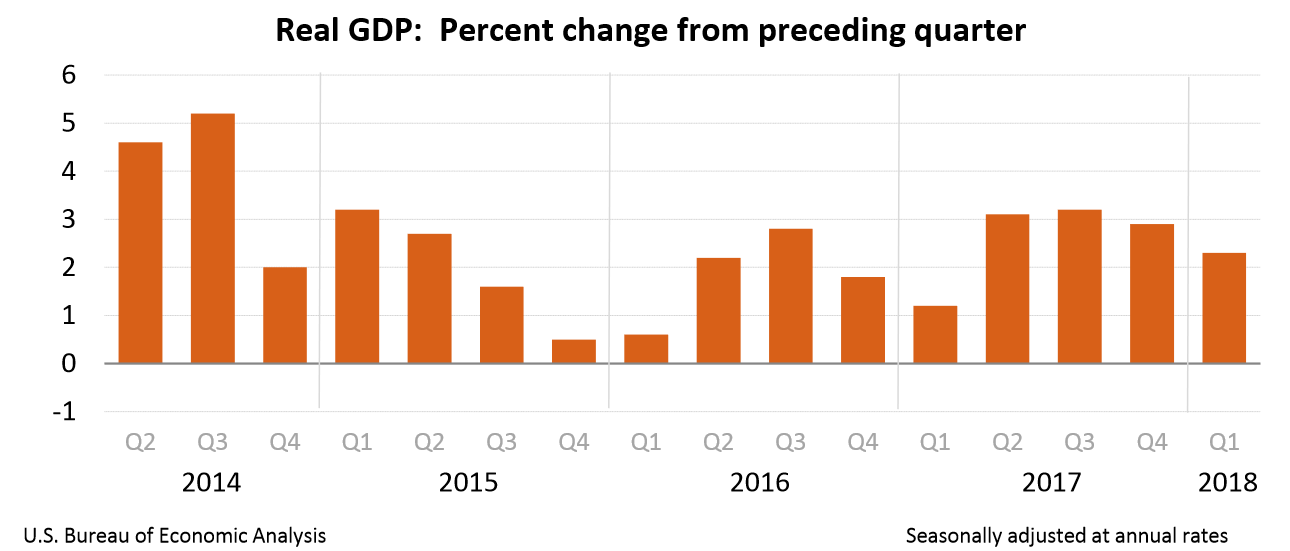
Bond yields have been rising recently in the US on the back of a strong economy. The 10-year bond yield topped 3% (up 0.66% over the past year) recently, the highest since January 2014. The 2-year bond yield topped 2.5% (up a massive 1.18% over the past year), the highest since July 2008 (Read more here). Continue reading “Can the US government really cope with rising bond yields?”

US Q1 2018 GDP estimated at 2.3% as personal consumption collapses; wage growth highest in a decade; personal saving rate falls

US real GDP increased at an annual rate of 2.3% in the first quarter of 2018 as per an advance estimate released by the Bureau of Economic Analysis.

US GDP Q1 2018
Source: U.S. Bureau of Economic Analysis

Continue reading “US Q1 2018 GDP estimated at 2.3% as personal consumption collapses; wage growth highest in a decade; personal saving rate falls”

Europe’s lost economic decade in charts

  • Parts of the European Union have seen GDP per capita shrink between 2007 and 2017 and the overall compounded annual growth rate for the European Union was just 1.2%
  • GDP growth for the European Union between 2007 and 2017 adjusted for inflation was negative
  • Banks in Greece, Cyprus, Portugal and Italy have a non-performing loan ratio of over 10% a decade on from the financial crisis and have only provisioned around 50% of the losses
  • The European Central Bank (ECB) is by far the biggest holder of European bonds and has a balance sheet of €4.5 trillion or some 45% of the GDP of the Eurozone
  • 18 of the 28 countries that are part of the European Union have seen house prices fall between 2008 and 2017
  • Greece has been the worst affected country, with its stock market down 85% since 2007, GDP per capita down 22% since 2007, house prices down 43% since 2008 and banks in Greece currently have a non-performing loan ratio of 42%
  • Eurozone Debt as % of GDP is gradually falling but is still historically high
  • Since the financial crisis of 2008, economic uncertainty has seen falling fertility rates for the European Union with population now set to fall over the coming decades

Continue reading “Europe’s lost economic decade in charts”

US 10-year bond yield over 3% as Greece 10-year bond yield falls below 4%; US 2-year bond yield hits 2.5%

US bond yields have soared recently with the 10-year bond yield hitting 3% today (up 0.66% over the past year), the highest since January 2014. The 2-year bond yield topped 2.5% (up a massive 1.18% over the past year), the highest since July 2008. Meanwhile, the Greece 10-year bond yield was lower than 4%, closing at 3.99% (down 2.45% over the past year), the lowest since 2005. Continue reading “US 10-year bond yield over 3% as Greece 10-year bond yield falls below 4%; US 2-year bond yield hits 2.5%”

Here’s how house prices in the European Union have changed between 2008 and 2017

Based on data from Eurostat, here are key takeaways about house prices in the European Union between 2008 and 2017,

  • 18 of the 28 countries that are part of the European Union saw house prices fall
  • 10 of the 28 countries that are part of the European Union saw house prices rise
  • Only 4 countries have seen prices rise over 10% during the entire period
  • 14 countries have seen prices fall over 10% during the entire period
  • Romania (-48.77%), Greece (-42.84%) and Spain (-30.50%) were the 3 worst performing countries for house prices
  • Sweden (+55.72%), Austria (+39.57%) and Luxembourg (+32.41%) were the 3 best performing countries for house prices
  • The average house price across the European Union fell 6.98% between 2008 and 2017
EU house price change 2008 to 2017, Source: Eurostat

Continue reading “Here’s how house prices in the European Union have changed between 2008 and 2017”

This is what has happened to the unemployment rate in the US four to eight months before every recession since the 1940s and why it matters now

The US Bureau of Labor Statistics data reveals that the US unemployment rate has a hit a new multi-year low four to eight months before the start of every recession since the 1940s. In other words, the economy hits full employment four to eight months before the start of a recession.

The graph below might help visualise it better (the shaded areas indicate recessions),

US unemployment rate 1948 to 2018
US unemployment rate (shaded areas indicate recessions); Source: U.S. Bureau of Labor Statistics

Why does this matter now? Continue reading “This is what has happened to the unemployment rate in the US four to eight months before every recession since the 1940s and why it matters now”

Weekly Overview: ECB sells yet another corporate bond after spotting an error; US Banks report Q1 results; Facebook moves user data from Ireland to the US

ECB sells yet another bond after spotting an error

The European Central Bank (ECB) via Bundesbank has sold yet another bond issued by Telefonica Deutschland a year after it bought it. The bond which was due to mature in 2021 breached an ECB rule that they should not hold bonds that pay a step-up coupon (one that could go up in value if certain conditions are met – in this case if the company was acquired).

This was the fourth time they found an error in 2018 and sold a corporate bond. When this happened a couple of weeks ago, we reported it here and asked how many more errors will the ECB find? Well, it would appear traders have taken notice. The ECB sold this bond just after a sharp fall in the price of the bond, implying traders know what all bonds the ECB has bought in error and is likely to sell. Continue reading “Weekly Overview: ECB sells yet another corporate bond after spotting an error; US Banks report Q1 results; Facebook moves user data from Ireland to the US”

US consumer and commercial debt hit record highs but charge-off and delinquency rates remain at low levels

Here is the debt outstanding for all commercial banks in the US (all data as of March 31, 2018),

Total consumer credit including student loans $3.9 trillion (up from $2.6 trillion in 2008)
Total commercial and industrial loans $2.15 trillion (up from $1.5 trillion in 2008)
Commercial real estate loans $2.1 trillion (up from $1.6 trillion in 2008)
Mortgage Backed Securities $1.76 trillion (up from $800 billion in 2009)
Student loans $1.5 trillion (up from $500 billion in 2008)
Consumer credit cards and other revolving credit $775 billion (up from $400 billion in 2008)
Mortgage debt $1.32 trillion (down from $1.42 trillion in 2008)

Total Consumer Credit Outstanding:

US Total Consumer Outstanding, All Commercial Banks
Source: Board of Governors of the Federal Reserve System (US)

Continue reading “US consumer and commercial debt hit record highs but charge-off and delinquency rates remain at low levels”