This is what is likely to happen when the European Central Bank ends bond buying

The European Central Bank (ECB) announced on Wednesday that it will halve its bond buys to 15 billion Euros (from the current 30 billion Euros) a month from October then shut the programme at the end of the year.

Source: European Central Bank

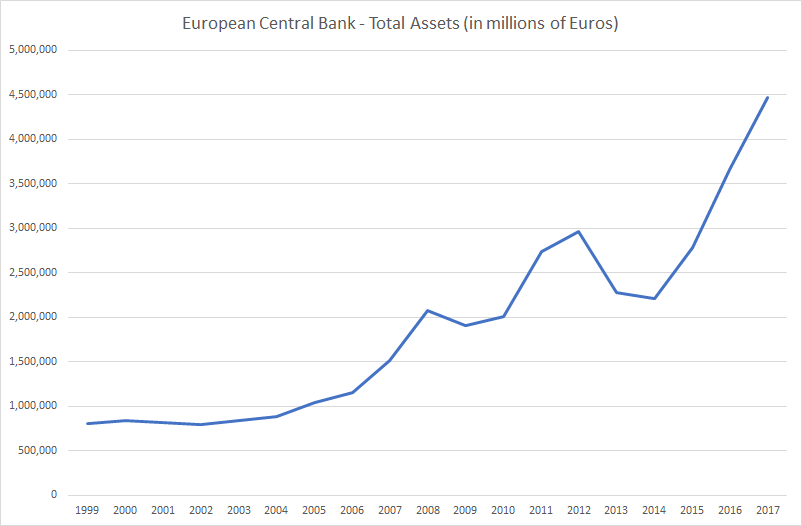
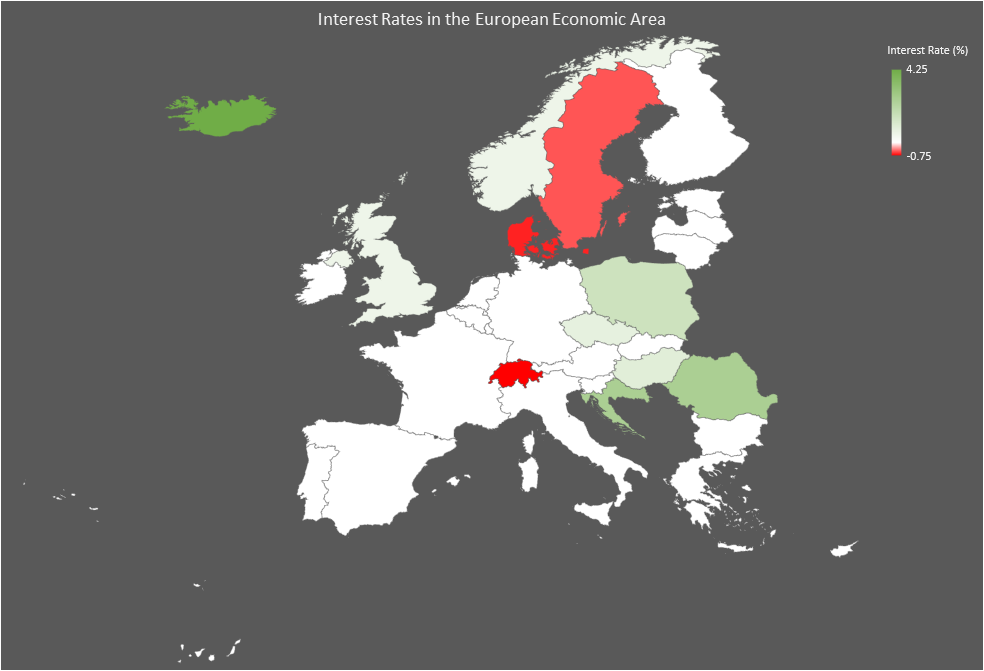
ECB’s balance sheet has increased by 2 trillion Euros since 2015 when it announced its bond buying programme. 2-year yields for most of the Eurozone countries are currently negative and 10-year yields in most cases are lower than that of the United States. The European Central Bank (ECB) is by far the biggest holder of European bonds and the biggest (almost 90%) buyer of the weaker Eurozone (Italy, Spain, Portugal and Greece) countries debt since 2015. The ECB balance sheet is now over 4.5 trillion Euros, some 45% of Eurozone GDP.

Continue reading “This is what is likely to happen when the European Central Bank ends bond buying”

Unemployment in Europe is lowest since 2008 but is still twice that of the United States

The Euro Area unemployment rate was 8.5% in April 2018, down from 8.6% in March 2018 and from 9.2% in April 2017. This is the lowest since December 2008 but still more than double of the US unemployment rate of 3.9% reported in April (the US unemployment rate further fell to 3.8% in May). The EU28 unemployment rate was 7.1% in April 2018, stable compared with March 2018 and down from 7.8% in April 2017. This remains the lowest rate recorded in the EU28 since September 2008.

Data Source: Eurostat (for the European Union and Iceland), State Secretariat for Economic Affairs (for Switzerland), Office for National Statistics (for the United Kingdom)

Continue reading “Unemployment in Europe is lowest since 2008 but is still twice that of the United States”

European Union Trade Statistics for January to March (Q1) 2018

Key highlights

  • The total trade surplus for the European Union increased from €15.6 bn in Q1 2017 to €19.1 bn in Q1 2018, total exports were 1.34 trillion and total imports were 1.33 trillion
  • 10 of the 28 European Union countries had a trade surplus in Q1 2018 and 18 had a trade deficit
  • Germany had the largest trade surplus in Q1 2018 at €62.2 bn, Netherlands at €15.8 bn and Ireland at €12.4 bn
  • The United Kingdom had the largest trade deficit in Q1 2018 at €41.1 bn, France at €21.2 bn and Spain at €7.9 bn

Continue reading “European Union Trade Statistics for January to March (Q1) 2018”

Iran trade with the US and Europe; Euro area consumer credit growth; Almost 3% coupon on 10-year Treasury bond; US yield curve inversion vs Euro area curve yield inversion

So, the US exits the Iran nuclear deal. The business impact of it?

Not much at all for the US. But a very major impact for Europe.

US exports to Iran
2015 exports were $282 million, 2016 were down to $172 million and 2017 were further down to $138 million

Iran exports to the US
Just $64 million in 2017

European exports to Iran
€10.8 billion ($12.80 billion) in 2017, has grown 10-fold since 2015

Iran exports to Europe
€10.14 billion ($12.02 billion) in 2017, has grown 10-fold since 2015 Continue reading “Iran trade with the US and Europe; Euro area consumer credit growth; Almost 3% coupon on 10-year Treasury bond; US yield curve inversion vs Euro area curve yield inversion”

Highlights from April 2018

Here are highlights from April 2018,

Our three most read posts in April 2018

1. Alphabet (the parent company of Google) spent the most as a company on lobbying. Facebook’s spend on lobbying increased 5500% since 2009. They spent most lobbying on changes to … data privacy (Click here to read).

2. This is what has happened to the unemployment rate in the US four to eight months before every recession since the 1940s and why it matters now (Click here to read).

3. Not an April Fools’ Day joke – this really is how the US Dollar has performed against each currency of the world over the past one year (Click here to read). Continue reading “Highlights from April 2018”

Europe’s lost economic decade in charts

  • Parts of the European Union have seen GDP per capita shrink between 2007 and 2017 and the overall compounded annual growth rate for the European Union was just 1.2%
  • GDP growth for the European Union between 2007 and 2017 adjusted for inflation was negative
  • Banks in Greece, Cyprus, Portugal and Italy have a non-performing loan ratio of over 10% a decade on from the financial crisis and have only provisioned around 50% of the losses
  • The European Central Bank (ECB) is by far the biggest holder of European bonds and has a balance sheet of €4.5 trillion or some 45% of the GDP of the Eurozone
  • 18 of the 28 countries that are part of the European Union have seen house prices fall between 2008 and 2017
  • Greece has been the worst affected country, with its stock market down 85% since 2007, GDP per capita down 22% since 2007, house prices down 43% since 2008 and banks in Greece currently have a non-performing loan ratio of 42%
  • Eurozone Debt as % of GDP is gradually falling but is still historically high
  • Since the financial crisis of 2008, economic uncertainty has seen falling fertility rates for the European Union with population now set to fall over the coming decades

Continue reading “Europe’s lost economic decade in charts”

Here’s how house prices in the European Union have changed between 2008 and 2017

Based on data from Eurostat, here are key takeaways about house prices in the European Union between 2008 and 2017,

  • 18 of the 28 countries that are part of the European Union saw house prices fall
  • 10 of the 28 countries that are part of the European Union saw house prices rise
  • Only 4 countries have seen prices rise over 10% during the entire period
  • 14 countries have seen prices fall over 10% during the entire period
  • Romania (-48.77%), Greece (-42.84%) and Spain (-30.50%) were the 3 worst performing countries for house prices
  • Sweden (+55.72%), Austria (+39.57%) and Luxembourg (+32.41%) were the 3 best performing countries for house prices
  • The average house price across the European Union fell 6.98% between 2008 and 2017
EU house price change 2008 to 2017, Source: Eurostat

Continue reading “Here’s how house prices in the European Union have changed between 2008 and 2017”