The Euro Area, China, Canada, Mexico and Japan together account for over 70% of U.S. trade. Have these countries (including the Euro Area group of countries) manipulated their currencies to boost exports? In this century (2000 onwards) the Chinese Yuan, the Canadian Dollar and the Euro have appreciated against the dollar. The Japanese Yen has been largely unchanged against the U.S. dollar since the start of this century and only the Mexican Peso has weakened against the dollar.
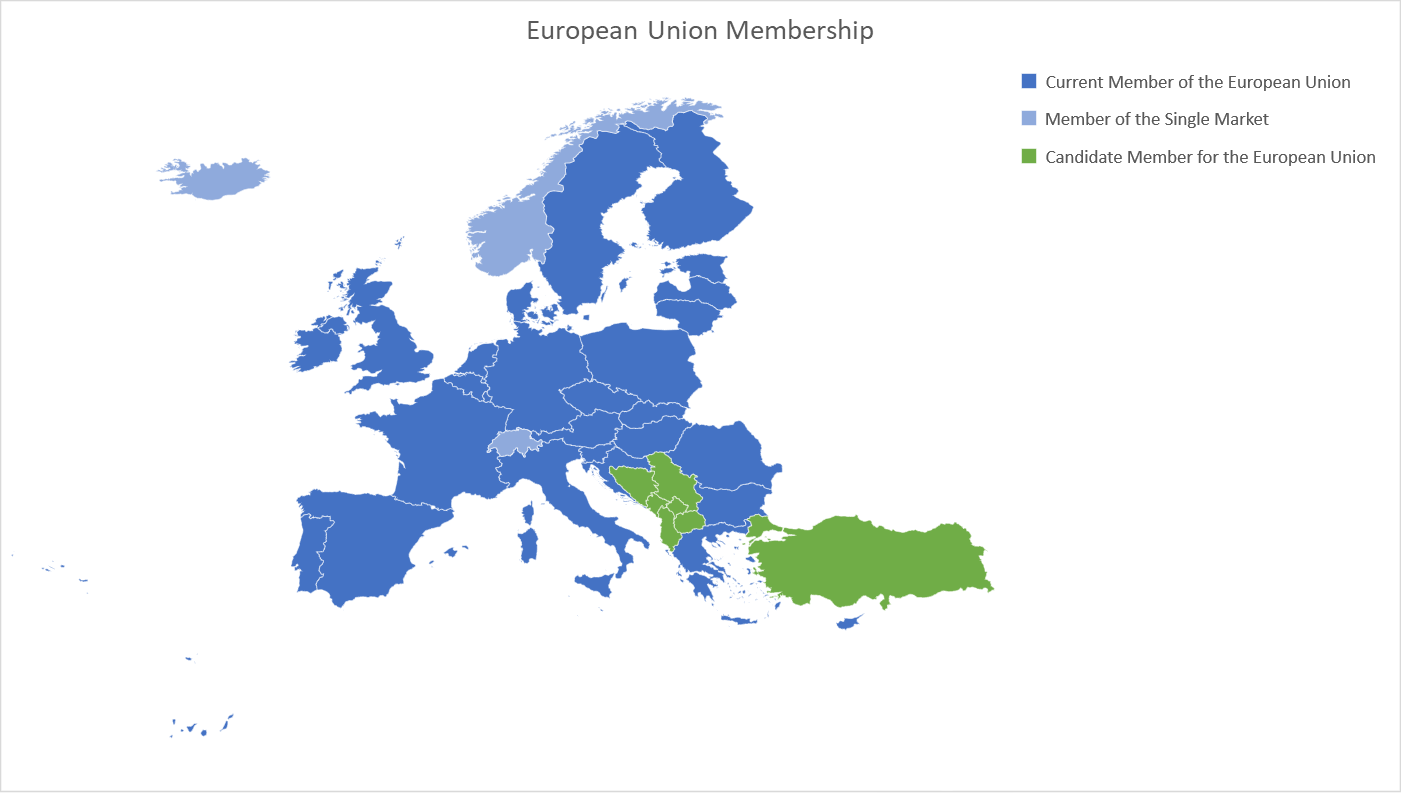
Here’s how the demographic and economic statistics look for candidate members of the European Union
We will be publishing a number of statistics for the United Kingdom (and the European Union) over the next few days in the run up to a major piece we will be publishing on the real economics of Brexit.
Montenegro, the former Yugoslav Republic of Macedonia, Albania, Serbia, Turkey, Bosnia and Herzegovina and Kosovo are countries on the road to join the European Union.
U.S. Trade Statistics for January to June 2018 – exports up 9.67% as imports up 8.66%, EU largest trade partner, China replaces Canada as second largest trade partner
U.S. trade with the world has grown despite tariffs and tariffs rhetoric in the first half (January to June) of 2018. There is one point of view that trade grew to avoid tariffs before they were implemented which might be partially true. Here are the key takeaways and the dataset,
Past, present, future – some demographic and economic statistics for the European Union
We will be publishing a number of statistics for the United Kingdom (and the European Union) over the next few days in the run up to a major piece we will be publishing on the real economics of Brexit.
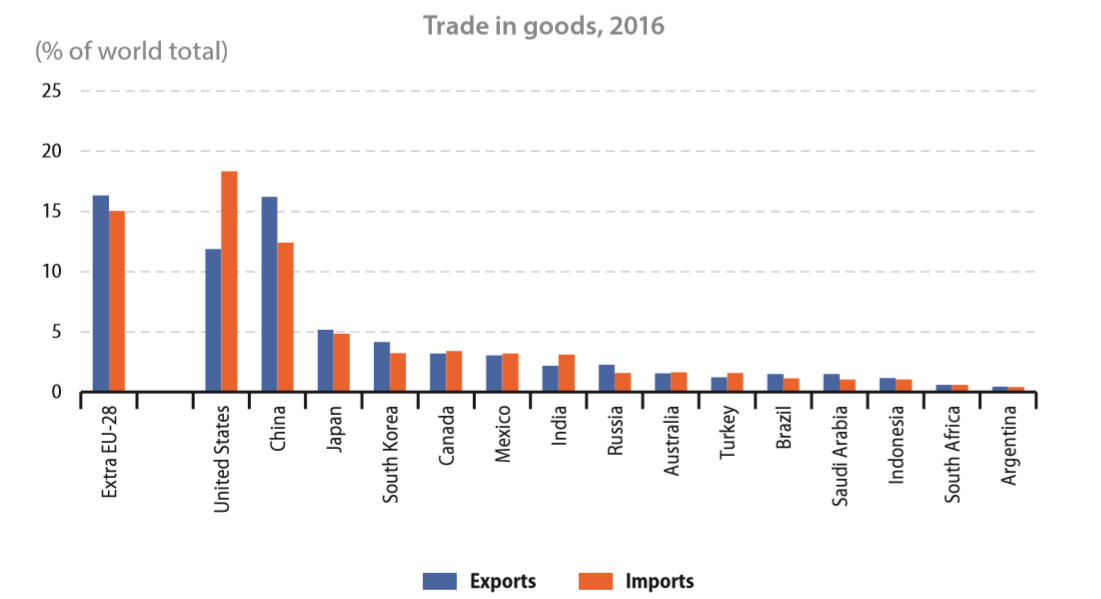
The European Union (and not China or the United States) accounted for the most trade in goods and services combined together
We will be publishing a number of statistics for the United Kingdom (and the European Union) over the next few days in the run up to a major piece we will be publishing on the real economics of Brexit.
The European Union (EU28 or EU) accounted for around one sixth of world trade in goods in 2016, with a 16.3% share of exports and a 15.0% share of imports. Turning to services the EU28’s contribution to world trade (mainly due to the United Kingdom which is leaving the European Union) was even greater, totalling 24.7% of exports and 21.1% of imports.
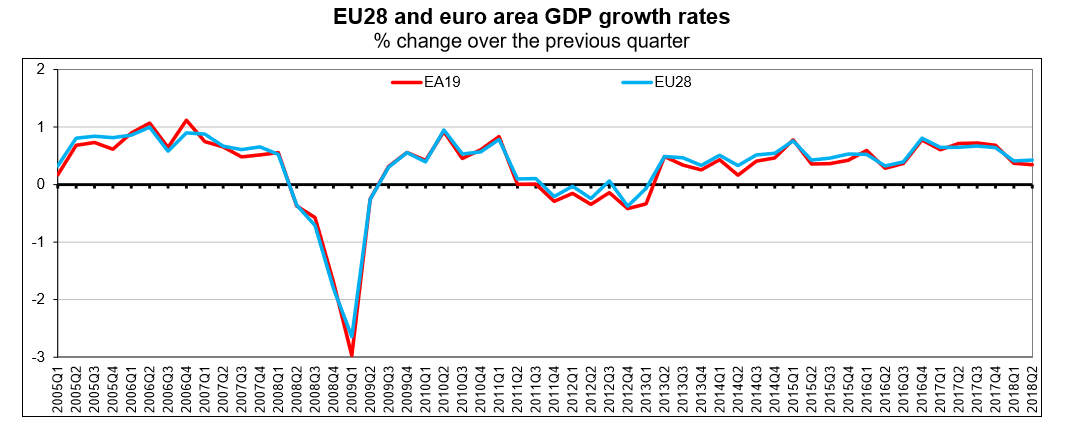
Eurozone Q2 2018 GDP up by 0.3% and European Union Q2 2018 GDP up by 0.4% as Household saving rate falls to the lowest in over a decade
Seasonally adjusted GDP rose by 0.3% in the Eurozone and by 0.4% in the European Union (EU28) during the second quarter (Q2) of 2018, compared with the previous quarter, according to a preliminary flash estimate published by Eurostat, the statistical office of the European Union.
The European Union just posted a record trade surplus with the United States (and a record trade deficit with Russia) for the January to May 2018 period
The first estimate for the European Union exports of goods in May 2018 was €160.9 billion, down by 2.7% compared with May 2017 (€165.4 bn). Imports from the rest of the world stood at €160.7 bn, down by 1.4% compared with May 2017 (€163.0 bn). As a result, the European Union recorded a €0.2 bn surplus in trade in goods with the rest of the world in May 2018, compared with a surplus of €2.3 bn in May 2017. Intra-European Union trade rose to €294.7 bn in May 2018, +1.6% compared with May 2017.
In January to May 2018, the European Union exports of goods rose to €786.6 bn (an increase of 1.5% compared with January-May 2017), while imports rose to €795.7 bn (an increase of 1.6% compared with January-May 2017). As a result, the European Union recorded a deficit of €9.1 bn, compared with a deficit of €8.1 bn in January-May 2017. Intra-European Union trade rose to €1457.3 bn in January-May 2018, +4.6% compared with January-May 2017.

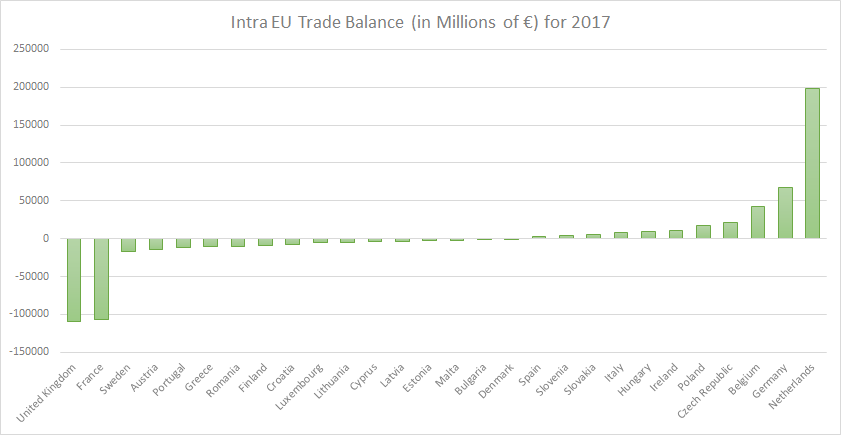
Intra European Union (EU) Trade Statistics for 2017 – Germany was the largest exporter and importer, the Netherlands had the largest surplus and the United Kingdom the largest deficit
Some surprises in Intra European Union (EU) Trade Statistics for 2017: Germany was the largest exporter as expected but unexpectedly also the largest importer. The Netherlands (and not Germany) had the largest trade surplus. The United Kingdom had the largest trade deficit (no trade deal Brexit still on the table?)
Here is additional information, the complete dataset and maps,
14 things about U.S. trade and trade tariffs
1. The U.S. has the 13th lowest average tariffs in the world as per the World Trade Organisation
We wrote about average import tariffs or custom duties per country, the United States has the 13th lowest tariffs in the world (out of the 165 members of the World Trade Organization) at only 3.48%.
2. … but the U.S. only charged 1.65% in tariffs in 2017
The WTO number is averaged across all products; the actual tariffs could be different based on the product mix of imports as well as any special trade deals the country may be part of.
In the case of the U.S., the actual import tariff or custom duty was just $38.49 billion or 1.65% of the value of $2.34 trillion in imports in 2017.
3. The U.S. did have a Trade deficit with Canada in 2017
Canada was the largest export market with exports of $282.47 billion in 2017. Canada was also the third largest market for imports behind only China and Mexico with total imports of $299.98 billion and a trade deficit of $17.5 billion. The trade deficit itself with Canada was the 12th largest for the U.S. in 2017.
4. All constituent countries taken together, the European Union was the largest export market for the U.S. in 2017
The U.S. had exports worth $284 billion to the 28 European Union Countries in 2017, beating Canada with $282.5 billion of exports in 2017. Continue reading “14 things about U.S. trade and trade tariffs”
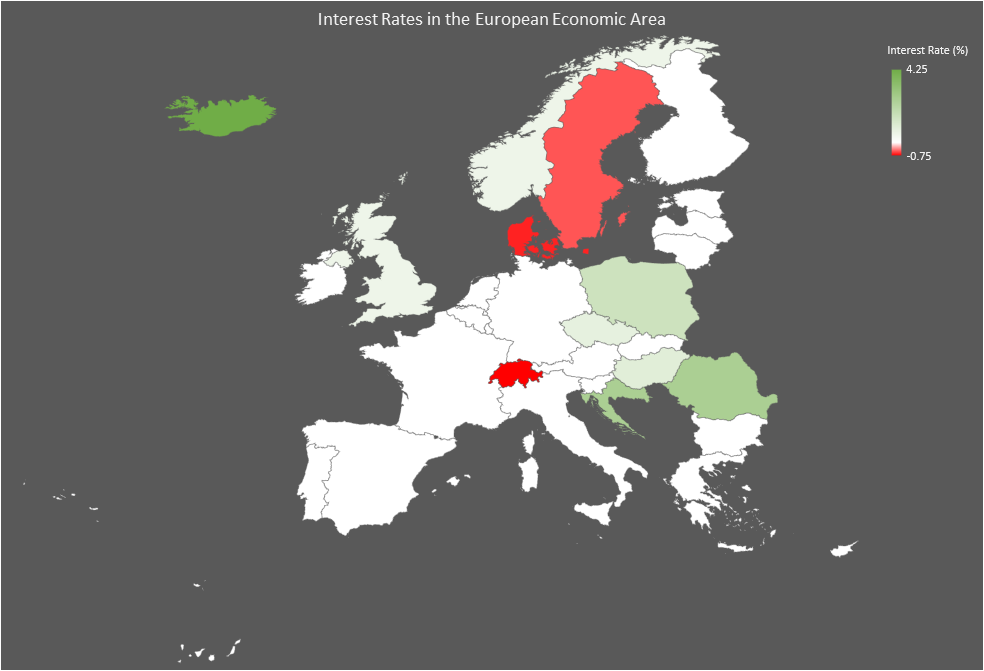
The U.S. and mainland Europe have moved in different directions over the past year on interest rates, equity returns, bond yields and government borrowing
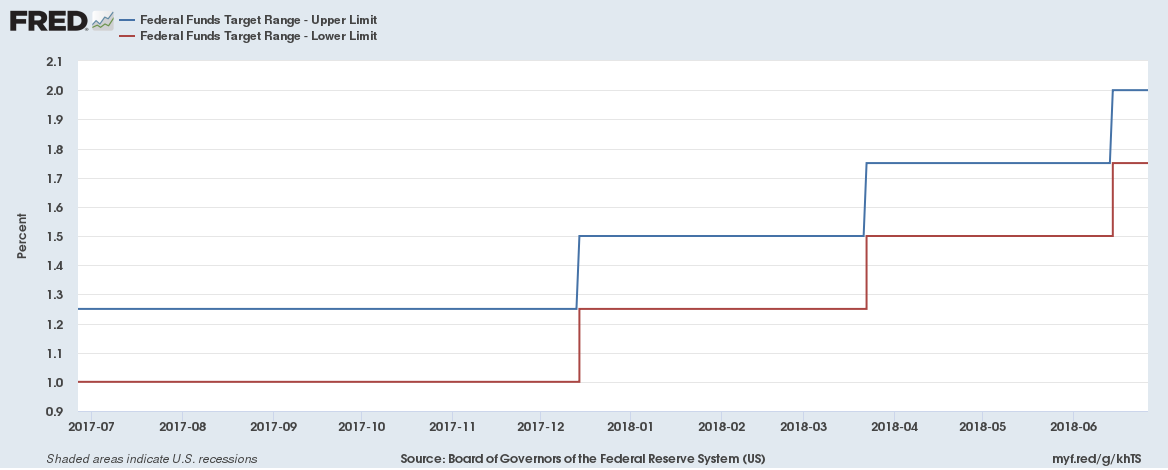
Interest Rates
What a difference a year makes. The Federal Reserve has hiked interest rates thrice (in December, March and June) with a target rate range of 1.75% to 2% now. The Eurozone meanwhile maintains its zero-interest rate policy.