Interest rates are headed downwards as global bond yields are falling quickly again

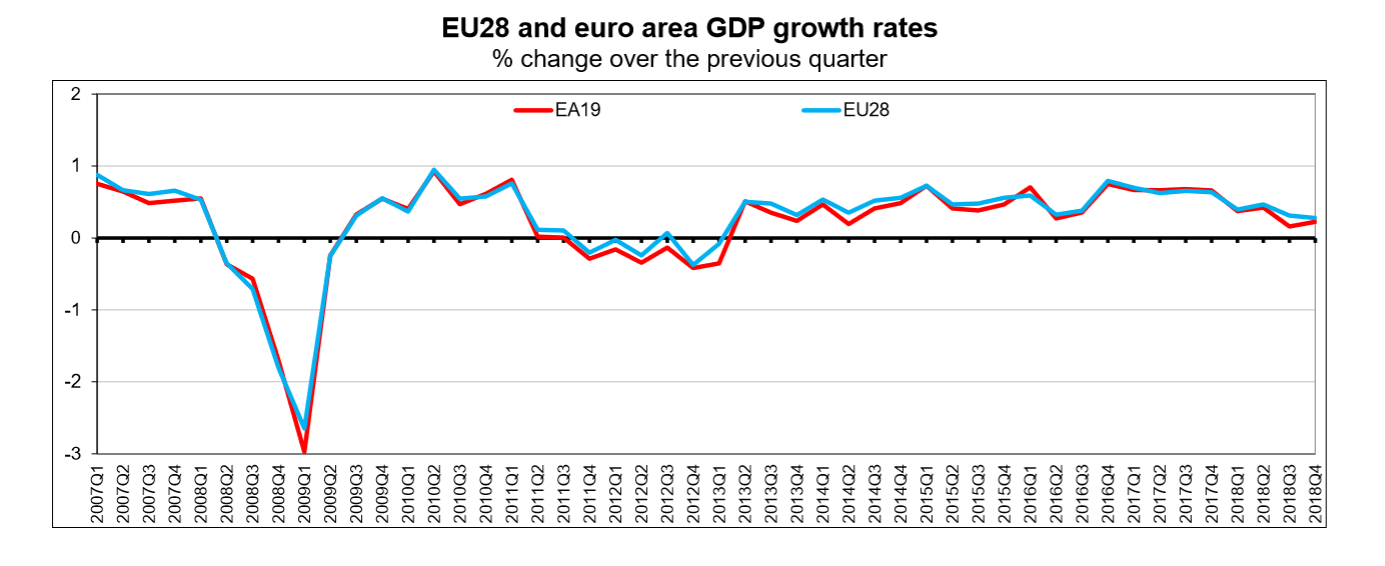
At the start of 2019 we wrote that 2019 will be a year that will be different with interest rate hikes slowing or interest rates even reversing.

Earlier this month the European Central Bank said interest rates would remain at record lows at least until the end of the year and then last week this was followed by the Federal Reserve saying that it does not expect an interest rate rise for the U.S. for the rest of 2019.

Continue reading “Interest rates are headed downwards as global bond yields are falling quickly again”

European Union and Eurozone trade statistics for 2018 – EU swings to a trade deficit; EU – record trade surplus with the U.S. and record trade deficit with Russia; UK had largest intra-EU trade deficit

The first estimate of Euro area or Eurozone (EA19) and European Union (EU28) trade statistics by Eurostat for 2018 reveals several interesting insights.

Continue reading “European Union and Eurozone trade statistics for 2018 – EU swings to a trade deficit; EU – record trade surplus with the U.S. and record trade deficit with Russia; UK had largest intra-EU trade deficit”

European Commission (again) cuts GDP growth forecast for the European Union; Bank of England cuts UK GDP growth forecast; Germany forecast to grow slower than the UK despite Brexit

The European Commission slashed their GDP growth forecast for the European Union (excluding the United Kingdom) and the Eurozone for 2019 and 2020 citing slowing growth in China and weakening global trade.

The growth forecast for 2019 for the European Union (excluding the United Kingdom) was cut to 1.5% for 2019 (was previously forecast 2%) and for the Eurozone was cut to 1.3% (was previously forecast 1.9%).

Germany, Italy and the Netherlands all saw big downgrades for their growth outlook.

Continue reading “European Commission (again) cuts GDP growth forecast for the European Union; Bank of England cuts UK GDP growth forecast; Germany forecast to grow slower than the UK despite Brexit”

Eurozone Q4 2018 GDP up by 0.2% and European Union Q4 2018 GDP up by 0.3%; 2018 annual GDP growth at 1.8% for the Eurozone and 1.9% for EU; Italy in Recession

Seasonally adjusted GDP rose by 0.2% in the Euro area or Eurozone (EA) and by 0.3% in the European Union (EU) during Q4 2018, compared with Q3 2018.

EU and Eurozone GDP up to Q4 2018
Source: Eurostat

Continue reading “Eurozone Q4 2018 GDP up by 0.2% and European Union Q4 2018 GDP up by 0.3%; 2018 annual GDP growth at 1.8% for the Eurozone and 1.9% for EU; Italy in Recession”

Europe’s aging population is set to cause huge economic challenges

We wrote about population percentage for each country by age last year. Here’s a map of population percentage for age 65 and above:

Japan has the highest percentage of over 65s at 26.56%. The other countries that make the top 25 countries for over 65s population are Italy, Germany, Portugal, Finland, Bulgaria, Greece, Sweden, Denmark, France, Croatia, Spain, Estonia, Austria, Malta, Lithuania, Czech Republic, Slovenia, Belgium, Netherlands, United Kingdom, Switzerland and Hungary all of which are in Europe.

Continue reading “Europe’s aging population is set to cause huge economic challenges”

Some aviation statistics for the European Union

A record of over 1 billion air passengers travelled by air in the European Union in 2017. In 2017, 1.04 billion passengers travelled by air in the European Union (EU), up by 7% compared with 2016 and by 39% compared with 2009.

In 2017, intra-EU transport represented almost half (47%) of total air passenger transport in the EU and extra-EU transport over a third (36%), while national transport accounted for fewer than 1 in every 5 passengers (17%).

Air passenger traffic in the European Union 2017
Source: Eurostat

Continue reading “Some aviation statistics for the European Union”

Here’s how much European Union Member states spend on social protection as percentage of GDP

Social protection expenditure in the European Union (EU) stood at 28.2% of GDP in 2016. In 2016, the two main sources of funding of social protection at EU level were social contributions, making up 55% of total receipts, and general government contributions from taxes at 40%.

Social protection expenditure by European Union member state
Source: Eurostat

Continue reading “Here’s how much European Union Member states spend on social protection as percentage of GDP”