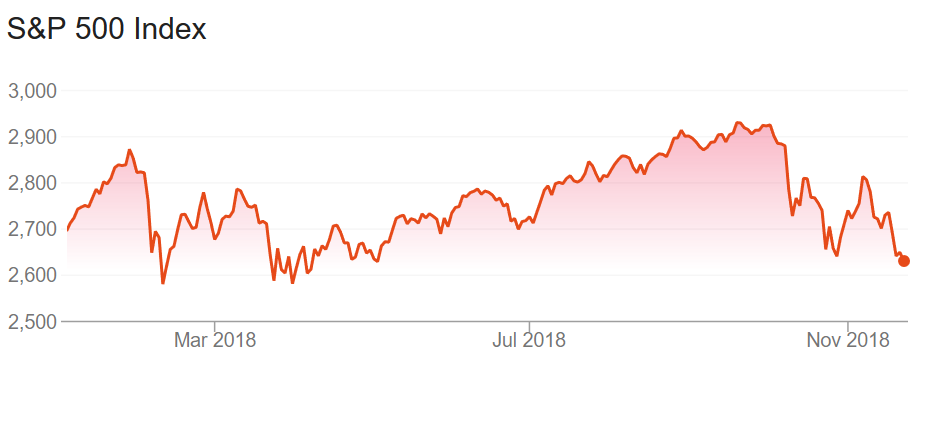
The S & P 500 and the NASDAQ 100 hit all time highs in early October and since then they have fallen about 10% each. The S & P 500 has turned negative for the year and the NASDAQ 100 has barely moved. FAANG (Facebook, Amazon, Apple, Netflix and Google/Alphabet) stocks accounted for almost all the 2018 gains until October. And their fall has caused the market meltdown but there is more to the story …
Eurozone and European Union trade stats for January to September 2018; EU trade surplus with the U.S. up 18% year on year as trade deficit with Russia up 38% year on year
In January to September 2018, Euro area or Eurozone exports of goods to the rest of the world rose to €1,686.0 bn (an increase of 3.6% compared with January to September 2017), while imports rose to €1,542.9 bn (an increase of 5.8% compared with January to September 2017). As a result, the euro area recorded a surplus of €143.1 bn, compared with +€169.2 bn in January-September 2017. Intra-euro area trade rose to €1,449.8 bn in January-September 2018, up by 5.7% compared with January-September 2017.
Is the Economic Winter here?
Early during the summer, we wrote how the global economy was scorching hot then just like the weather but winter was coming. Weather wise (unless you are in Australia or New Zealand) winter is here and it appears the global economic winter is not too far away.
U.S. student debt outstanding now stands at $1.56 trillion but growth is slowest ever; Is university education value for money?
U.S. student debt outstanding now stands at a record $1.56 trillion, almost doubling in the past 8 years.
Germany Q3 2018 GDP shrank 0.2% on the previous quarter (worst since 2015), did Eurozone really grow 0.2%?
The Federal Statistical Office (Destatis) reported that the German GDP shrank by 0.2% in the third quarter (vs the second quarter) of 2018. Growth was +1.1% on the same quarter a year earlier following increases of 2.3% in the second quarter (calendar adjusted: +2.0%) and 1.4% in the first quarter of 2018 (calendar adjusted: +2.1%).
Just two charts – Oil and the Baltic Dry Index
We will write a lot more about the economy over the weekend but in the meanwhile here are two charts,
U.S. crude has continued its longest losing streak since it began trading in New York more than three decades ago having plunged more than $20 a barrel since the start of October when it hit a 4-year high. Oil prices fell 8% today. From shortage fears to over-supply concerns …
Continue reading “Just two charts – Oil and the Baltic Dry Index”
Nominal wages in the UK grew fastest in a decade but real wages are still lower than a decade ago
As widely expected, wages are rising in the UK, at least partially due to labour shortages down to Brexit. Nominal wage growth was fastest in a decade, but real (adjusted for inflation) wages are still lower than a decade ago. We recently also wrote about why wages weren’t rising despite record employment and labour shortages.
General Electric was the world’s most valuable company in 2000 worth $480 billion, today it is worth $75 billion
“Go for a business that any idiot can run – because sooner or later, any idiot probably is going to run it.” ― Peter Lynch
Credit Rating(s) cut, quarterly dividend virtually eliminated from 12 cents to a penny, new CEO (again), new strategy, $5 billion in underfunded pensions …
Both the European Commission and the IMF are forecasting lower GDP growth in Europe
Both the European Commission and the IMF recently published their forecasts on growth in Europe. Both have lowered forecasts for growth between 2018 and 2020 in Europe.
UK Q3 2018 GDP increased by 0.6% (growing 3 times quicker than the Eurozone and at the fastest pace since 2016) but business investment fell
UK gross domestic product (GDP) in volume terms was estimated to have increased by 0.6% between Quarter 2 (Apr to June) 2018 and Quarter 3 (July to Sept) 2018.
In comparison with the same quarter in the previous year, the UK economy has grown by 1.5%, continuing its relatively subdued performance over the last year.