We will write a lot more about the economy over the weekend but in the meanwhile here are two charts,
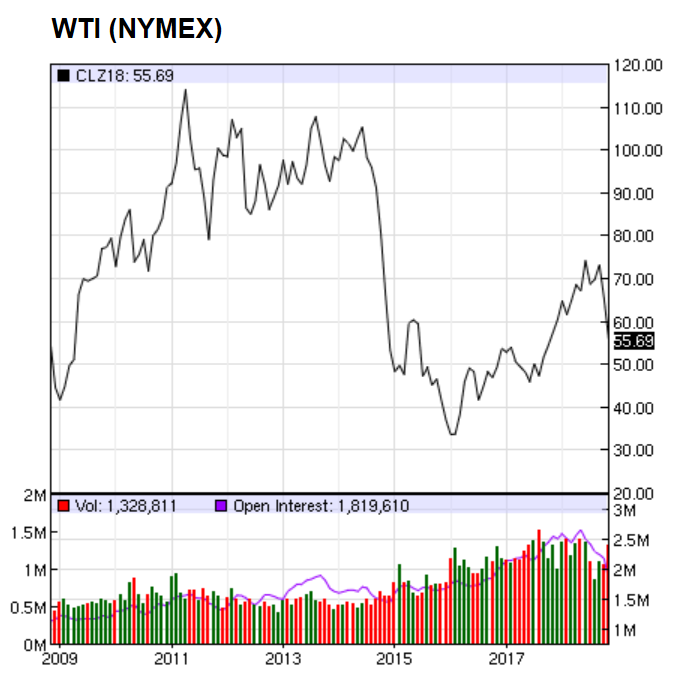
U.S. crude has continued its longest losing streak since it began trading in New York more than three decades ago having plunged more than $20 a barrel since the start of October when it hit a 4-year high. Oil prices fell 8% today. From shortage fears to over-supply concerns …
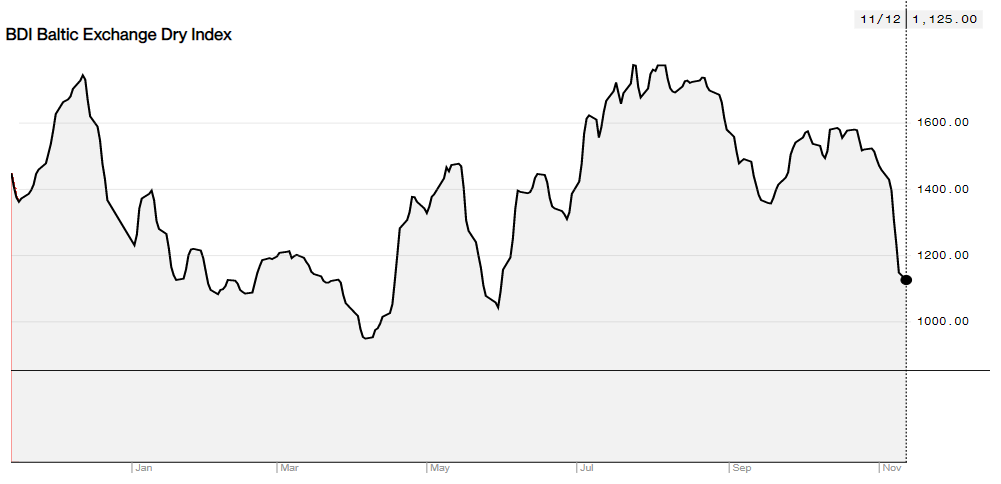
Meanwhile the Baltic Dry Index is down some 26% this week and down some 33% over the past month. The Baltic Dry Index is a trade indicator that measures shipping prices of major raw materials and is often seen as a global growth indicator.
When I want to know how the economy is doing these are the two I reference. Have been for years, can’t imagine better indicators.