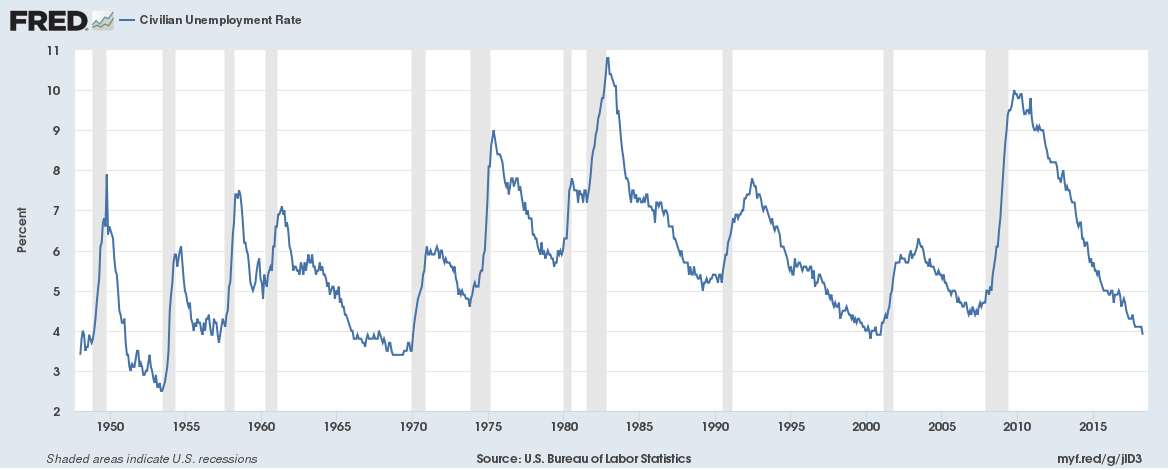
The U.S. unemployment rate is at an 18-year low,
Weekly Overview: Emerging Market Rout; New Italian Government; Japan GDP; Oil surge continues
Emerging Markets are being routed with rising oil and a soaring US dollar
Here is the performance of the US dollar against emerging market currencies (figures in brackets are 1-month % change),
USD/MXN – Mexico 19.9450 (+8.17%)
USD/INR – India 67.9850 (+3.23%)
USD/TRY – Turkey 4.4894 (+10.07%)
USD/BRL – Brazil 3.7375 (+10.33%)
USD/ZAR – South Africa 12.7550 (+6.71%) Continue reading “Weekly Overview: Emerging Market Rout; New Italian Government; Japan GDP; Oil surge continues”
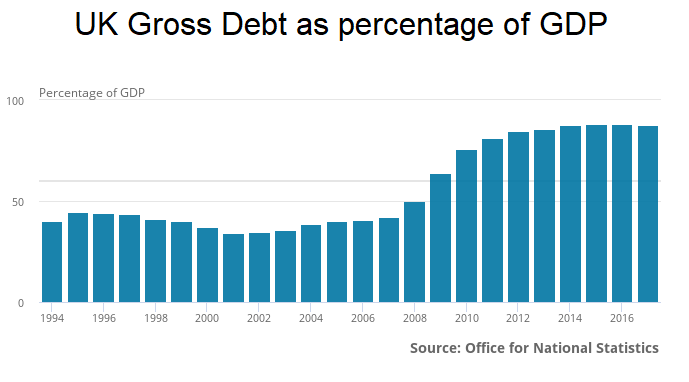
Can the UK Government afford higher interest rates or rising bond yields?
We recently wrote about the impact of rising interest rates for UK households, read more about it here. We also wrote about the impact of higher bond yields for the US government, read more about it here.
Impact of higher interest rates for the UK Government
The UK government has around £1.72 trillion in debt and pays around £36 billion in interest payments a year (an effective interest rate of 2%).
The UK tax revenues are around £800 billion a year, which would mean 4.5% of all tax revenues are paid as interest. The UK has paid £540 billion in interest since it last ran a surplus in 2001.
 Continue reading “Can the UK Government afford higher interest rates or rising bond yields?”
A brief history of global trade or reserve currencies
Historically, just a single currency has played a dominant role globally.
Historic global trade currencies
The silver Drachma issued by ancient Athens in the 5th Century B.C. was most likely the first currency that was widely circulated.
The gold Aureus and silver Denarius coins issued by Rome were next and they were the dominant currencies from 1st Century B.C. to 4th Century A.D.
Inflation caused major devaluation of the Roman-issued currencies, causing them to become increasingly less accepted making way for the Byzantine Empire’s gold Solidus coin to become the dominant currency in international trade from the 5th Century to 6th Century. Continue reading “A brief history of global trade or reserve currencies”
US and emerging market bond yields soar; UK retail; US Student debt; German GDP
US and emerging market bond yields
The US 10-year bond yield soared to 3.09% today (up 75 bps over the past year and 25 bps over the past month), the highest since 2011. The 2-year yield hit 2.59%, the highest since August 2008 (read more here on the financial impact of rising yields for the US Government).
The bigger story is of emerging markets though. Brazilian and Indian 10-year yields have soared 33 bps in just a week. The Brazilian 10-year bond yield topped 10.12% while the Indian 10-year bond yield topped 7.91%. The US dollar has gained 7% against the Brazilian Real and 4% against the Indian Rupee over the past month.
Canadian bond yields are soaring the most amongst developed nations with the 10-year yield hitting 2.51%, up 94 bps over the past year and 24 bps over the past month. Continue reading “US and emerging market bond yields soar; UK retail; US Student debt; German GDP”
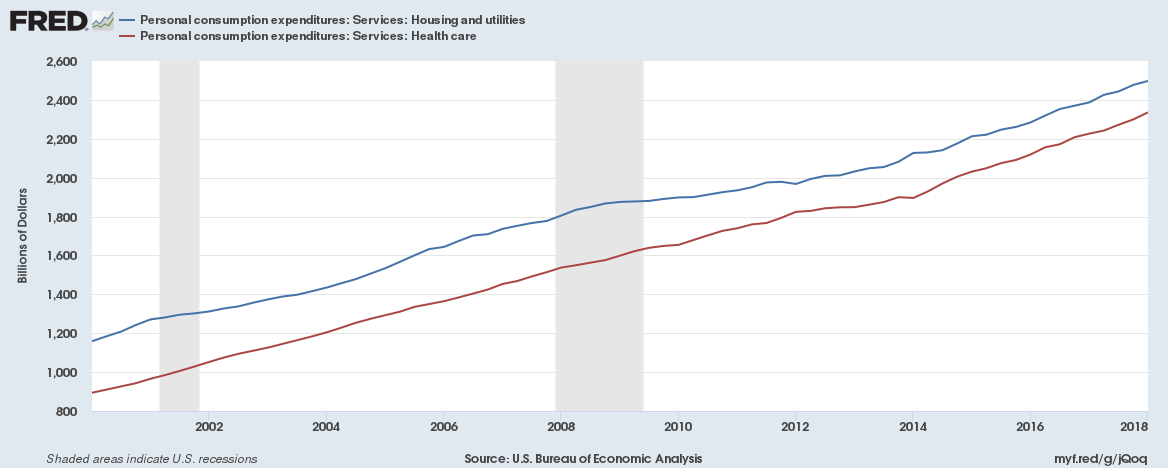
Healthcare could soon be the largest expenditure of households in the U.S.
Healthcare could be the largest personal consumption expenditure of households in the U.S. within months exceeding spend on Housing and utilities.
Households in the U.S. are likely to spend some $2.45 trillion this year on healthcare. The spending on healthcare is quickly catching up with the largest expenditure item – Housing and utilities. Here are charts,
 Continue reading “Healthcare could soon be the largest expenditure of households in the U.S.”
Weekly Overview: The Baltic Dry Index is up 48% over the past month; Argentina seeks IMF bailout; UK House Prices; Brazil 10-year bond tops 10%; Coal prices soaring
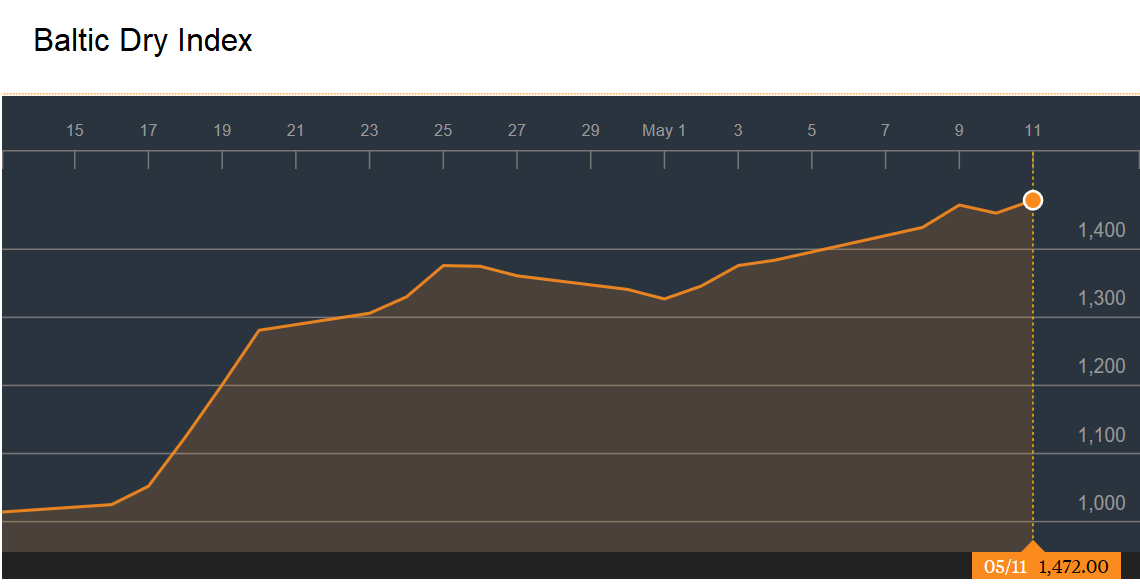
Baltic Dry Index
The Baltic Dry Index is a trade indicator that measures shipping prices of major raw materials and is often seen as a global growth indicator.
Over the past month, it has zoomed 48%. It is up 45% over the past year and is up 8% since the start of the year. This despite weaker US, UK and France Q1 2018 GDP growth. The Baltic Dry index generally falls in the first quarter on back of lower trading activity due to the Chinese New Year but this time it hadn’t recovered until very recently.
Here is a chart of the index over the past month,
The curious case of low U.S. money velocity
From the Federal Reserve’s definition of Money Velocity and Money Supply,
Money Velocity
The velocity of money is the frequency at which one unit of currency is used to purchase domestically- produced goods and services within a given time period. In other words, it is the number of times one dollar is spent to buy goods and services per unit of time. If the velocity of money is increasing, then more transactions are occurring between individuals in an economy. Continue reading “The curious case of low U.S. money velocity”
Four reasons stock valuations are still soaring
1. Liquidity
Central Banks have created loads of new money with quantitative easing. There is simply too much liquidity in the markets. Here is a chart of the M3 money supply for the US,
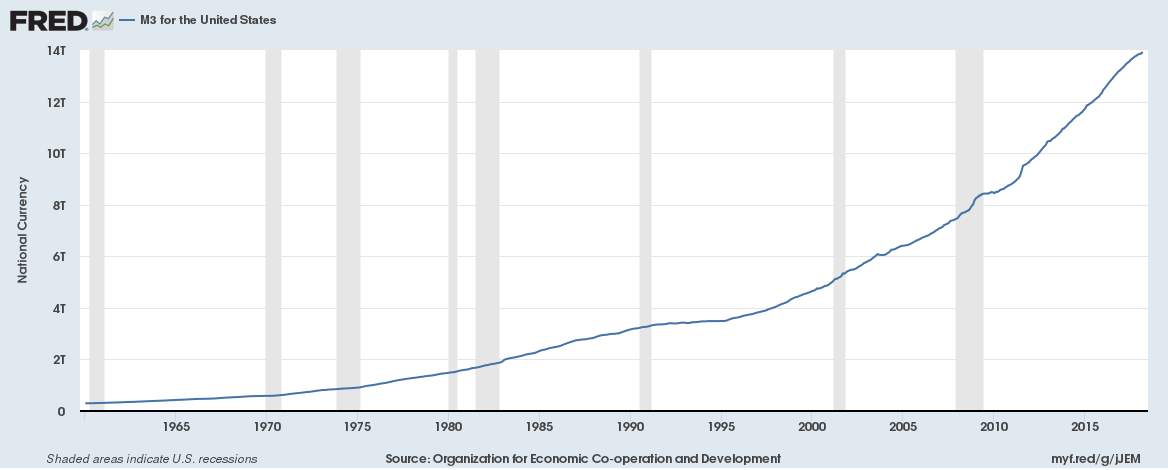
Continue reading “Four reasons stock valuations are still soaring”
Iran trade with the US and Europe; Euro area consumer credit growth; Almost 3% coupon on 10-year Treasury bond; US yield curve inversion vs Euro area curve yield inversion
So, the US exits the Iran nuclear deal. The business impact of it?
Not much at all for the US. But a very major impact for Europe.
US exports to Iran
2015 exports were $282 million, 2016 were down to $172 million and 2017 were further down to $138 million
Iran exports to the US
Just $64 million in 2017
European exports to Iran
€10.8 billion ($12.80 billion) in 2017, has grown 10-fold since 2015
Iran exports to Europe
€10.14 billion ($12.02 billion) in 2017, has grown 10-fold since 2015 Continue reading “Iran trade with the US and Europe; Euro area consumer credit growth; Almost 3% coupon on 10-year Treasury bond; US yield curve inversion vs Euro area curve yield inversion”