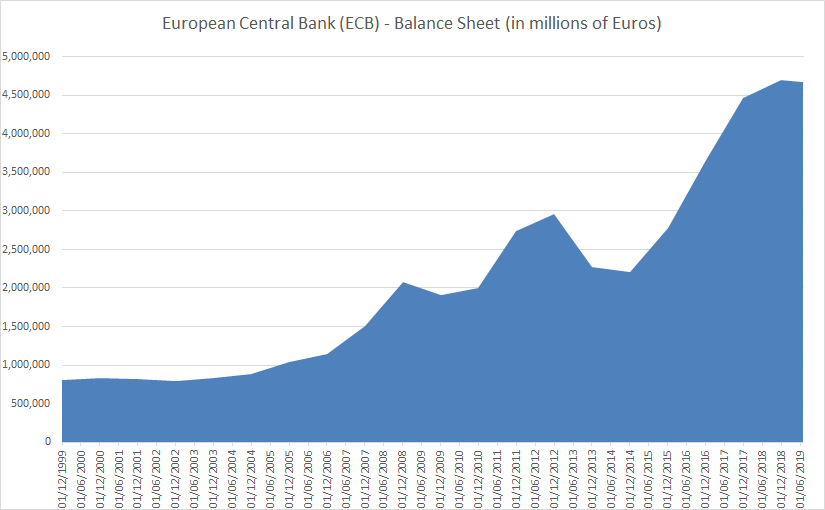
Apparently, the European Central Bank (ECB) balance sheet was meant to shrink significantly in 2019. It has shrunk just 0.5% in 2019 until July 5th (as against 5% for the Federal Reserve in the same period).
At 4.67 trillion Euros (or around 41% of Euro area or Eurozone GDP), it doesn’t look like things are going to change quickly.
Interest Rates on hold
Earlier in the year, the Governing Council of the European Central Bank (ECB) said that it expects the key ECB interest rates to remain at their present levels at least through the end of 2019.
The interest rate on the main refinancing operations and the interest rates on the marginal lending facility and the deposit facility are 0.00%, 0.25% and -0.40% respectively and these rates are expected to remain in place at least until the end of 2019.
More Stimulus
Back then, the ECB also announced a new series of quarterly targeted longer-term refinancing operations (TLTRO-III) will be launched, starting in September 2019 and ending in March 2021, each with a maturity of two years. These new operations will help to preserve favourable bank lending conditions and the smooth transmission of monetary policy. Under TLTRO-III, counterparties will be entitled to borrow up to 30% of the stock of eligible loans as at 28 February 2019 at a rate indexed to the interest rate on the main refinancing operations over the life of each operation.
Targeted longer-term refinancing operations (TLTROs) are one of the ECB’s non-standard monetary policy tools. Through TLTROs, the ECB provides long-term loans to banks and offers them an incentive to increase their lending to businesses and consumers in the Eurozone. The first TLTRO series was launched in 2014. The second one, introduced in March 2016, was called TLTRO-II.
… but wasn’t the balance sheet supposed to shrink significantly?
It was supposed to.

The European Central Bank (ECB) only started its Quantitative Easing (or QE) program in March 2015 in order to fight ultralow inflation in the Eurozone (also called the Euro Area).
This somewhat worked by weakening the Euro (€), increasing exports, giving the stock market a boost and drastically lowering financing costs for European governments and corporations.

The ECB has always lagged the U.S. Federal Reserve in terms of policy decisions. The late start of its QE programme meant the late “recovery” of the Eurozone.
Given the late start as compared to the U.S., the ECB only started reducing the pace of its asset purchases in March 2017 from €80 to €60 billion per month until December 2017.
In late 2017 it further announced that it will scale back its net purchase to €30 billion per month from January until at least September 2018, which was subsequently extended to December 2018.
Why reduce the size of the balance sheet?
As the global financial crisis unfolded, the ECB and other central banks introduced new policies such as Quantitative Easing (QE) to support growth.
The idea was to weaken the currency (the Euro in this case), increase exports, lower financing costs for European governments and corporations and give the stock market a boost. These measures are no longer required as the Eurozone is (apparently) growing well.
How is the ECB likely to reduce its balance sheet (when and if it eventually does)?
The ECB has said that it will reduce its bond buying net purchases until they reach zero, before raising rates and ceasing the reinvestment of the principal of its maturing assets.
For the moment, the ECB has managed to scale back its asset purchases without causing mayhem much trouble in the European bond market, but we have written earlier that European Countries only have a fiscal surplus due to ultra-low interest costs (thanks to ultra-low bond yields because of the ECB bond buying program).
What is the new normal for the ECB?
Before the financial crisis, “normal” for the ECB meant key interest rate of 3% (currently 0%), the ECB balance sheet being under 10% of Eurozone GDP (it is currently 41%), short term financing as assets with banks (it is currently 90% long term) and a minimum reserve ratio of 2% (it is currently 1%).
What will the new normal mean? Well, don’t expect the old normal to be the new normal. It is highly unlikely that the key interest rate will be 3% before 2023 unless there is a major crisis and the ECB is forced to raise interest rates to that level.
The ECB is also unlikely to unwind its balance sheet by €3 trillion to bring the balance sheet to GDP ratio back to 10%. However, current projections state that by 2038 (20 years away) the ECB balance sheet will be back to 10% of Eurozone GDP.
The Reserve ratio could be increased but given that the European banking crisis is far from over, this is unlikely to happen soon either. The new normal is likely to be low (if not ultra-low) interest rates, an expanded balance sheet and continued support for weak Eurozone banks.
What happens in case of a recession? More Quantitative Easing (QE), long term negative interest rates (as against zero now) or hyper-inflation? Or perhaps all of them?
Related:
The Federal Reserve is unwinding its balance sheet, here’s why and how it is doing it
Euro Area or Eurozone Money Velocity seems to be shockingly low
The Bank of England Balance sheet has been expanding rather quickly recently
Dear TTID-Team,
I just discovered your website yesterday and it is really helpful. Thank you for the good work!
I am now wondering how are you calculated those 40% CBBS to GDP Ratio. I also tried to calculated it with the numbers which the FRED provides (https://fred.stlouisfed.org/series/EUNNGDP & https://fred.stlouisfed.org/series/ECBASSETS) but I am getting way different numbers. I divided the CBBS with the GDP.
Maybe I can get some ‘help’ from you guys, I would really appreciate it!
Kind regards from Germany
Christian
The GDP numbers you are looking at are Quarterly numbers, we have taken GDP as a rolling four Quarter (annualized) average and the numbers do match as we have the same data source (ECB and Eurostat).