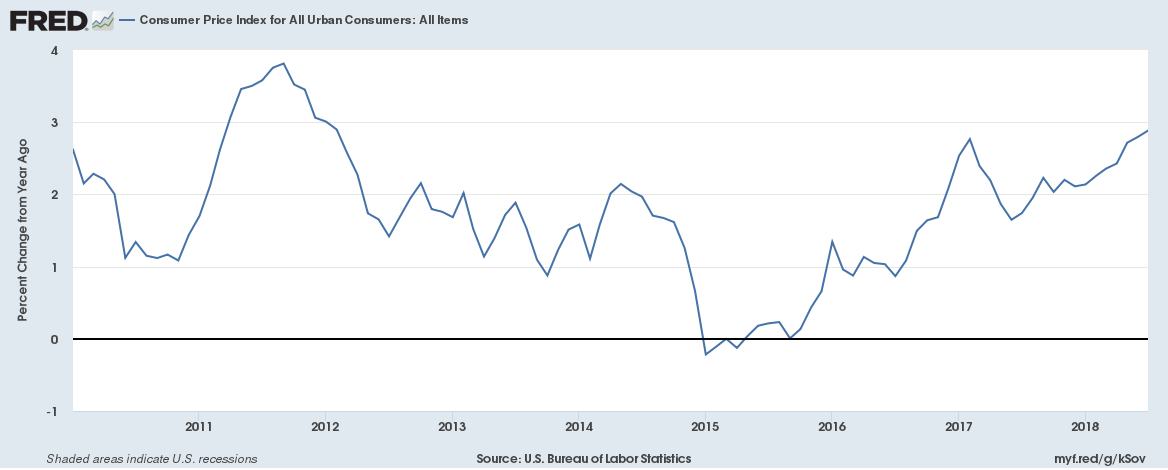
U.S. Consumer Inflation at 2.9% is the highest since February 2012. And it isn’t just energy prices causing inflation to soar. Core inflation (which is Consumer inflation excluding volatile energy and food prices) at 2.4% has risen at the fastest pace in a decade. Here is a chart for CPI inflation growth,
Here’s how you can get updates by email for new posts on this site
We don’t have an email mailing list or email subscription facility currently because we simply do not want to hold any user data due to global data protection laws. But there are ways to receive updates for new posts on this site.
Continue reading “Here’s how you can get updates by email for new posts on this site”
History is repeating itself, is this the end of the current cycle of global synchronised growth?
We wrote earlier this year on the downsides of synchronised global growth. We wrote that when global synchronised growth begins to end the U.S. dollar strengthens, investors run away from emerging markets, interest rates continue to rise to tame inflation and bad debt becomes an issue. All of this is happening now, first the US Dollar, here is the 1-year performance of the U.S. Dollar mapped,
UK Q2 2018 GDP increased by 0.4% (growing faster than the Eurozone) as widening trade deficit drags growth
UK GDP in volume terms was estimated to have increased by 0.4% between Q1 2018 and Q2 2018. GDP rose by 1.3% in Q2 2018 compared with the same quarter a year ago.
Euro Area or Eurozone Money Velocity seems to be shockingly low
We couldn’t find any official Money Velocity numbers for the Euro Area (Eurozone) so calculated it using the Equation of Exchange
Equation of Exchange
MV=PQ
Money Supply (M) * Money Velocity (V) = Price level (P) * Real economic output (Q)
Which means Money Supply * Money Velocity = Nominal GDP
Therefore, Money Velocity = Nominal GDP/Money Supply
We have the numbers for both Money Supply (from OECD – Organization for Economic Co-operation and Development) and Nominal GDP (from Eurostat) for the Euro Area.
Continue reading “Euro Area or Eurozone Money Velocity seems to be shockingly low”
The great U.S. Government bond yield convergence chart
U.S. 2-year, 3-year, 5-year, 7-year, 10-year, 20-year and 30-year yields are all converging. Looks like a beautiful chart, just one thing …
Continue reading “The great U.S. Government bond yield convergence chart”
China hasn’t been selling U.S. Government Bonds despite trade tensions
Is China selling U.S Government Bonds (Treasury Bills, T-Bonds and Notes) given the trade war tensions between China and the United States? The simple answer to that is no. Actually, no major foreign country holder of bonds is really selling.
But you might wonder what is going on if you make a chart look like this,
Continue reading “China hasn’t been selling U.S. Government Bonds despite trade tensions”
The European Union (and not China or the United States) accounted for the most trade in goods and services combined together
We will be publishing a number of statistics for the United Kingdom (and the European Union) over the next few days in the run up to a major piece we will be publishing on the real economics of Brexit.
The European Union (EU28 or EU) accounted for around one sixth of world trade in goods in 2016, with a 16.3% share of exports and a 15.0% share of imports. Turning to services the EU28’s contribution to world trade (mainly due to the United Kingdom which is leaving the European Union) was even greater, totalling 24.7% of exports and 21.1% of imports.
UK Trade Statistics for trade by each country
We will be publishing a number of statistics for the United Kingdom over the next few days in the run up to a major piece we will be publishing on the real economics of Brexit. In the meanwhile, here are trade statistics for the United Kingdom for 2016 (the latest full year of data available) sourced from the Office for National Statistics.
The top 5 countries for total trade value were Germany (£95.67 billion), the United States (£84.09 billion), the Netherlands (£53.93 billion), China (£52.51 billion) and France (£44.40 billion)
Continue reading “UK Trade Statistics for trade by each country”
Banks in the United States have a problem – they can’t find enough customers to lend money to
Since the financial crisis of 2008-2009 the difference between bank deposit growth and bank loan growth in the U.S. diverged in a big way, graph below,