Did interest rates rise or fall globally in 2018?
Continue reading “Here are interest rates for every country and how much they changed in 2018”
Why wouldn’t it be?
Did interest rates rise or fall globally in 2018?
Continue reading “Here are interest rates for every country and how much they changed in 2018”
We wrote about three slightly different U.S. recession indicators that have been predictive of the past few recessions and have been tracking how near or far are those from being invoked, here’s where we are at the end of 2018,
Records are being broken shattered …
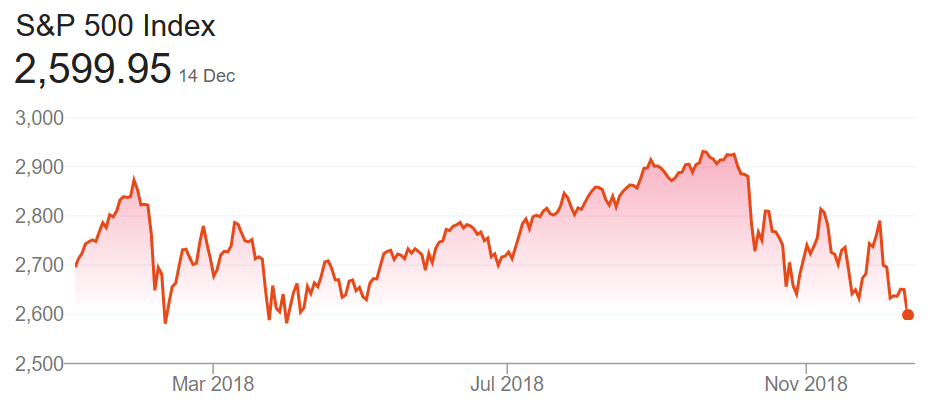
Continue reading “The U.S. equity market meltdown in numbers”
A record of over 1 billion air passengers travelled by air in the European Union in 2017. In 2017, 1.04 billion passengers travelled by air in the European Union (EU), up by 7% compared with 2016 and by 39% compared with 2009.
In 2017, intra-EU transport represented almost half (47%) of total air passenger transport in the EU and extra-EU transport over a third (36%), while national transport accounted for fewer than 1 in every 5 passengers (17%).
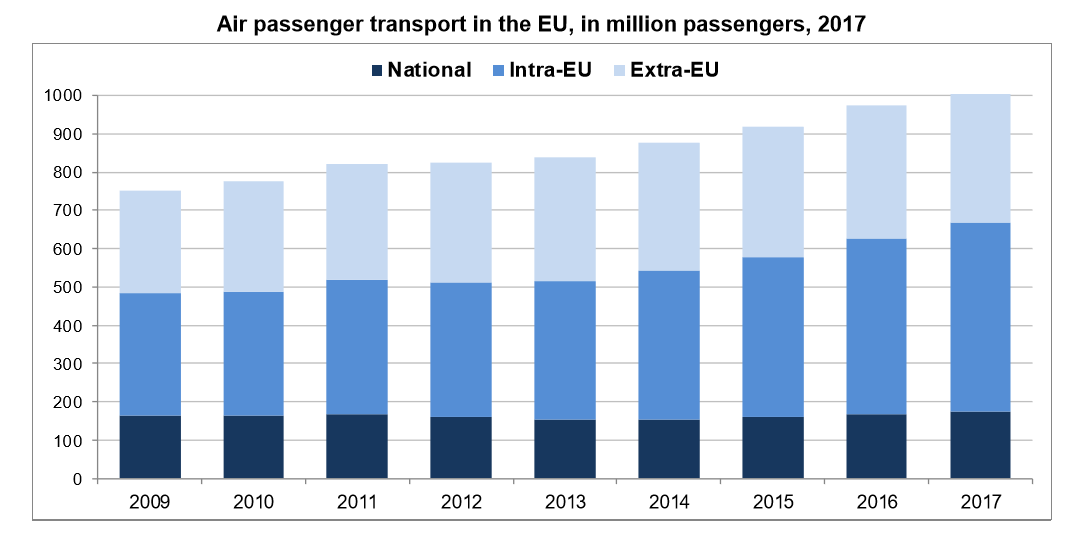
Continue reading “Some aviation statistics for the European Union”
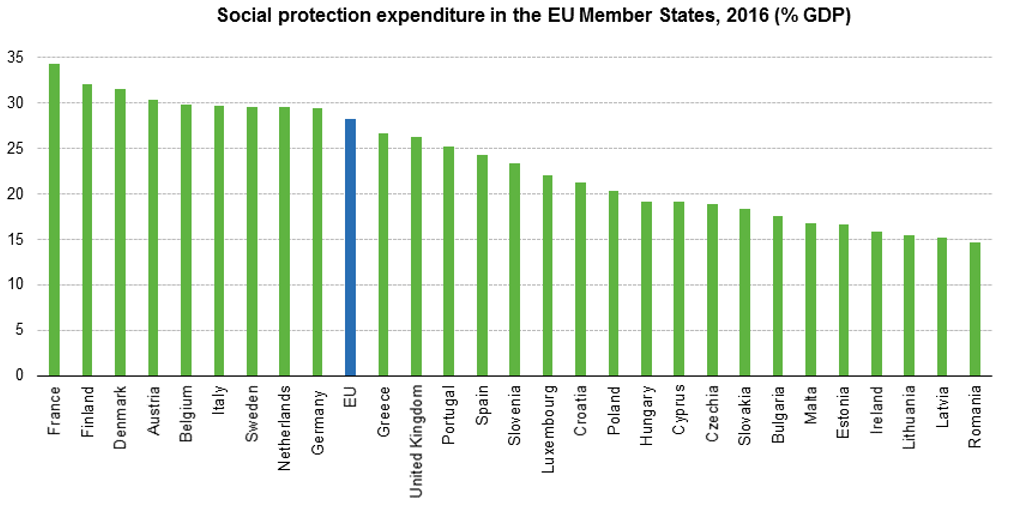
Social protection expenditure in the European Union (EU) stood at 28.2% of GDP in 2016. In 2016, the two main sources of funding of social protection at EU level were social contributions, making up 55% of total receipts, and general government contributions from taxes at 40%.
Sweden’s Central Bank, the Riksbank raised interest rates for the first time in seven years on Thursday which might cause further European monetary tightening. Riksbank’s benchmark repo rate was raised 25 bps from -0.5% earlier to -0.25%. It still remains negative though.

The fiscal situation in the United States is worsening as government debt piles up. The U.S. government (Federal, state and local combined) now spends $1.24 for every $1 in income.
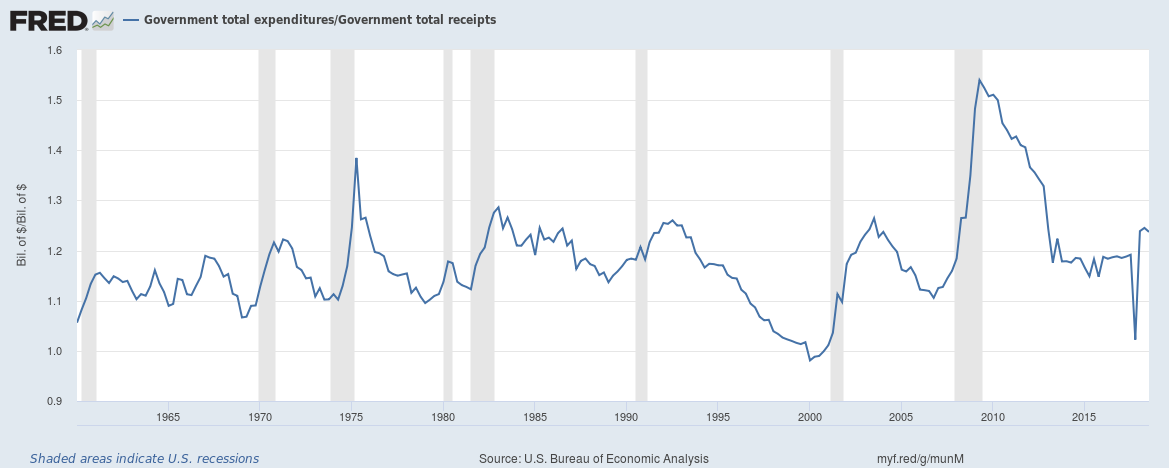
Continue reading “The U.S. Government is now spending $1.24 for every $1 in income”
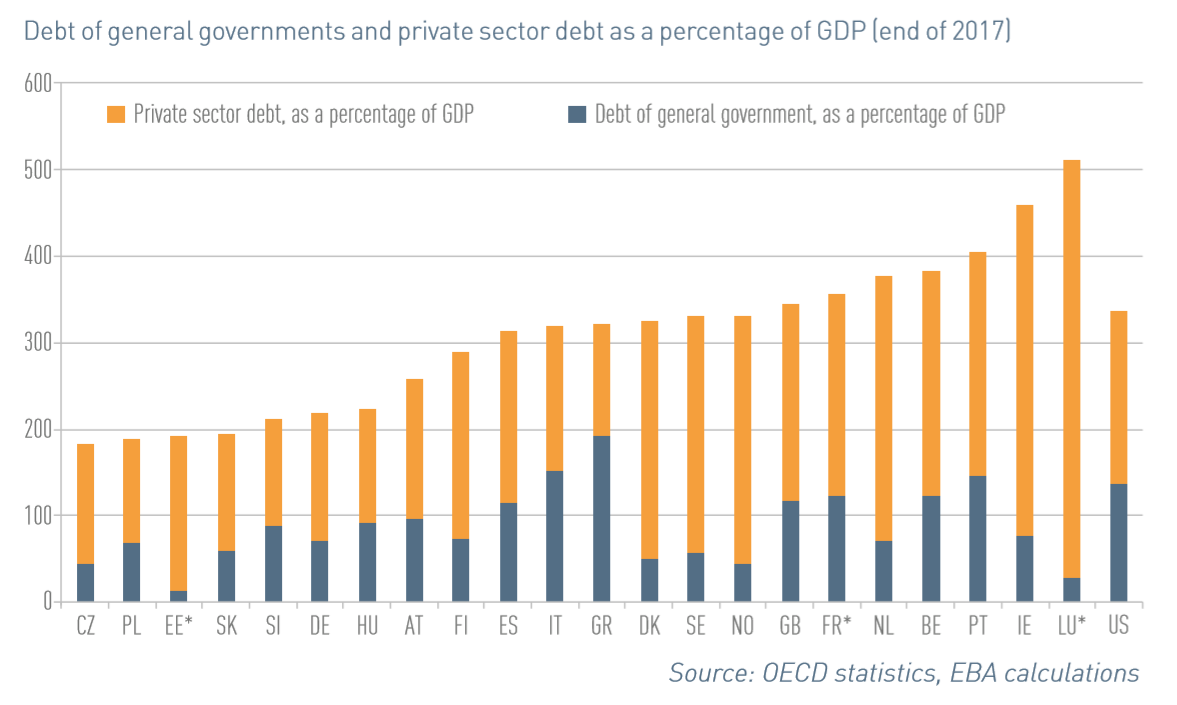
European Union Debt to GDP
European Union total debt (Debt of general governments and the private sector) as percentage of GDP is now over 300%. Ireland’s total debt to GDP is an eye watering 450%. A decade ago the EU total debt to GDP was 180%, the debt bubble is well and truly here.
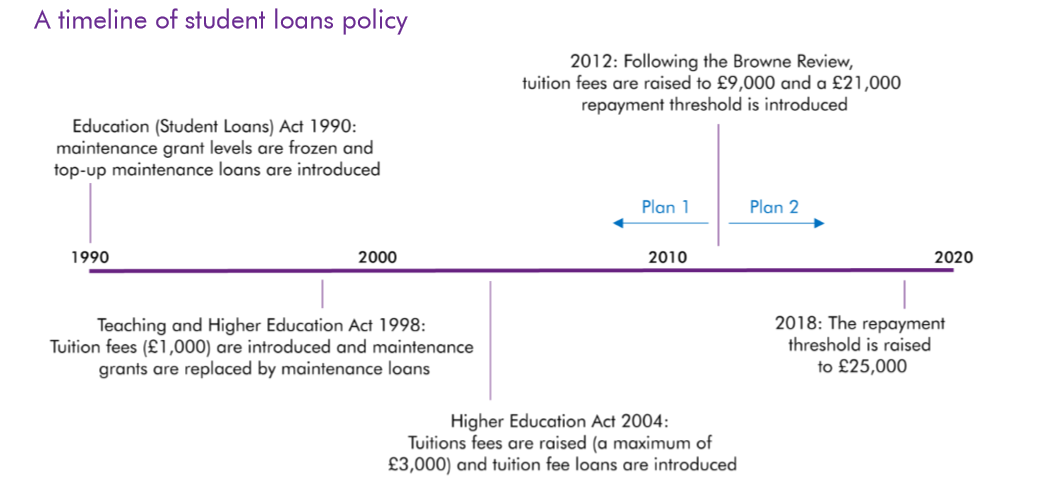
The UK’s higher education funding system is unique in many ways and a change today is quite significant in terms of fiscal accounting. Firstly, here’s a timeline of the student loan system in the UK.
We look back at 2018 year end S&P 500 targets as 2018 draws to a close. The S&P 500 is currently down about 3% year to date and unless something drastic happens almost every major Wall Street strategist will be way off with their target for the S&P 500 for 2018. We also look at 2019 targets which are all bullish again. Will the predictions for 2019 be any better on target than they were for 2018?