We wrote about three slightly different U.S. recession indicators that have been predictive of the past few recessions and have been tracking how near or far are those from being invoked, here’s where we are in March 2019,
Unemployment rate
The US Bureau of Labor Statistics data reveals that the U.S. unemployment rate has hit a new multi-year low four to eight months before the start of every recession since the 1940s. In other words, the economy hits full employment four to eight months before the start of a recession.
The unemployment rate goes up at least 1% and then doesn’t go back down without a recession occurring.
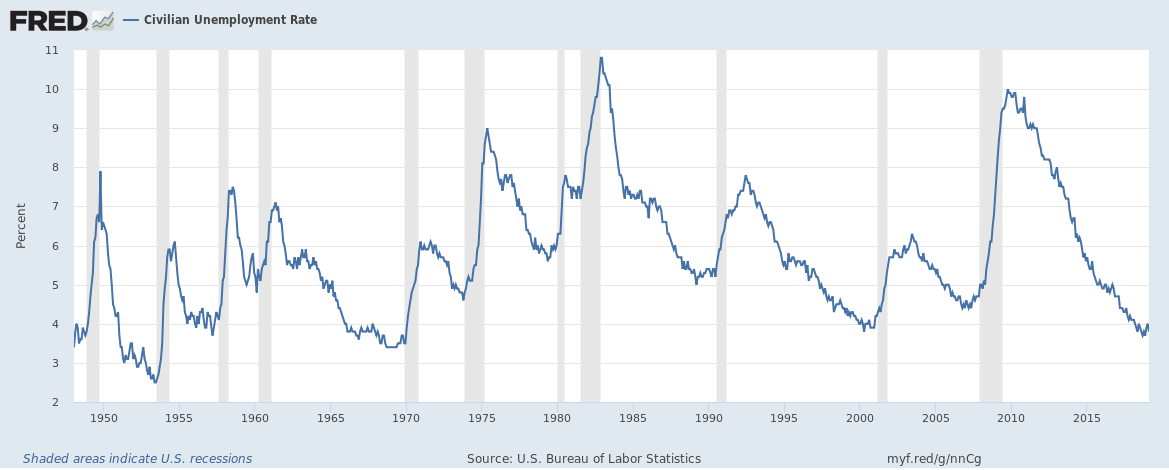
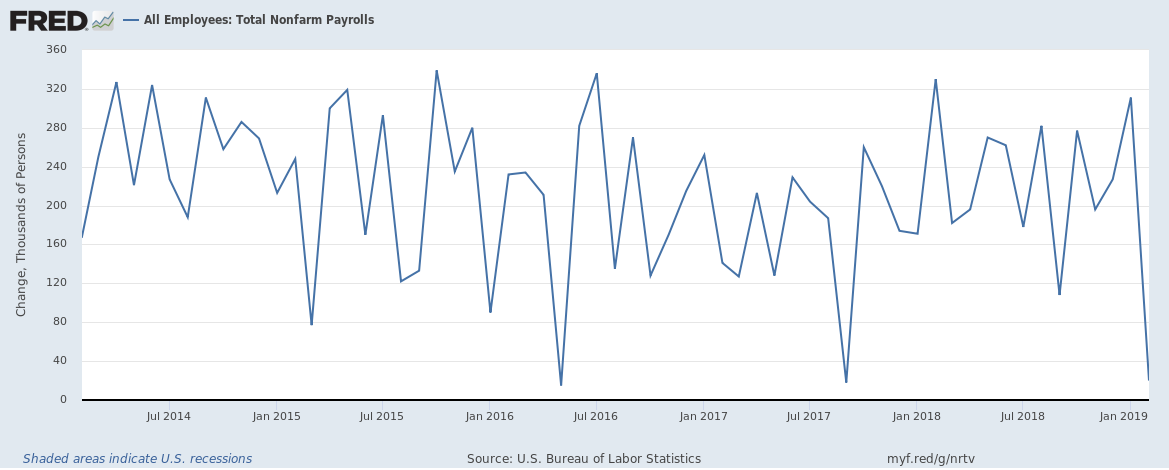
The current U.S. unemployment rate is 3.8% (Related: The U.S. unemployment rate is at an 18-year low but only because the labor force participation rate is close to a 40-year low) and U.S. employers added just 20,000 jobs in February, but yet the unemployment rate fell from 4% to 3.8% thanks to more people quitting the labour market. (Related: Is the U.S. unemployment rate low due to increased hiring or an increasing number of people quitting the labour force?). Going forward, U.S. employers must add at least 160,000 jobs a month (assuming that the number of people joining and leaving the labour market remains the same as it did in 2018) to keep the unemployment rate at the current level.
The U.S. job market is quite robust at the moment but there could be potential issues going forward if corporate earnings weaken. (Related: U.S. Corporate profits have been growing well and have hit a record high)
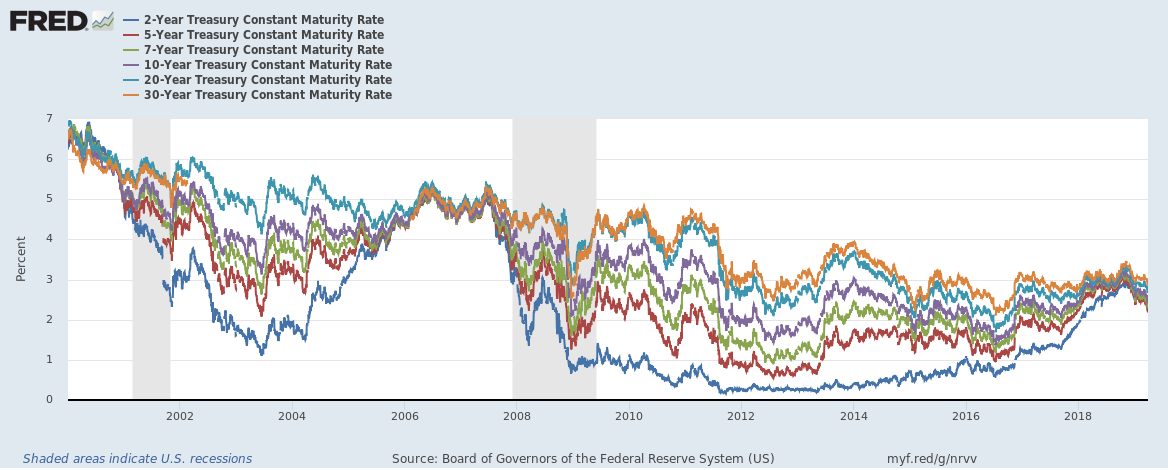
Yield curve inversion
The US 10-year Treasury constant maturity yield minus the 2-year Treasury constant maturity yield spread has been a good indicator of past recessions. (Related: The yield curve inversion plus why banks and banking stocks are impacted by it)
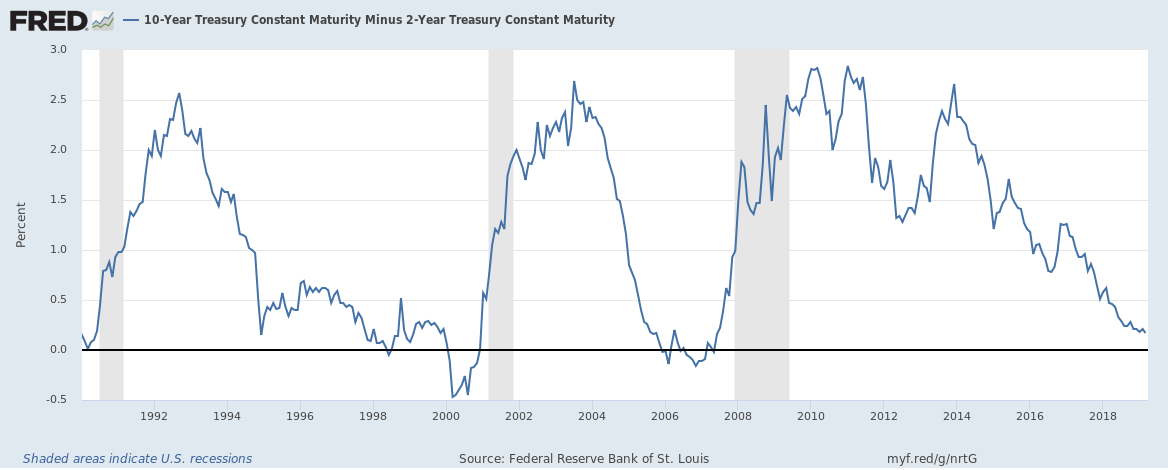
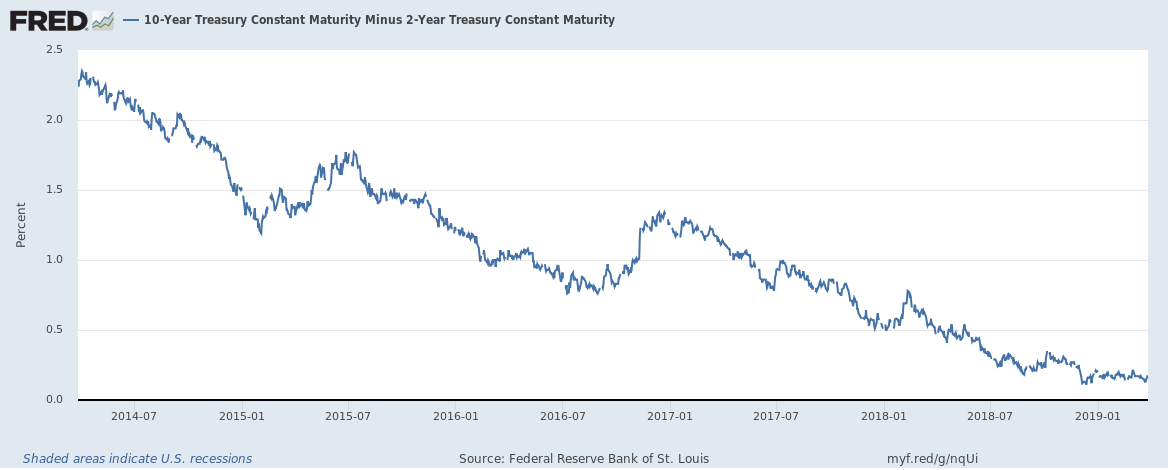
Yield curve inversion happens when the spread turns negative and has preceded the last seven straight recessions. Currently the difference is just 17 bps.
Treasury yield curve convergence
The 30-year, 20-year and 10-year Treasury yields have almost converged three to six months before each of the past four recessions as well.
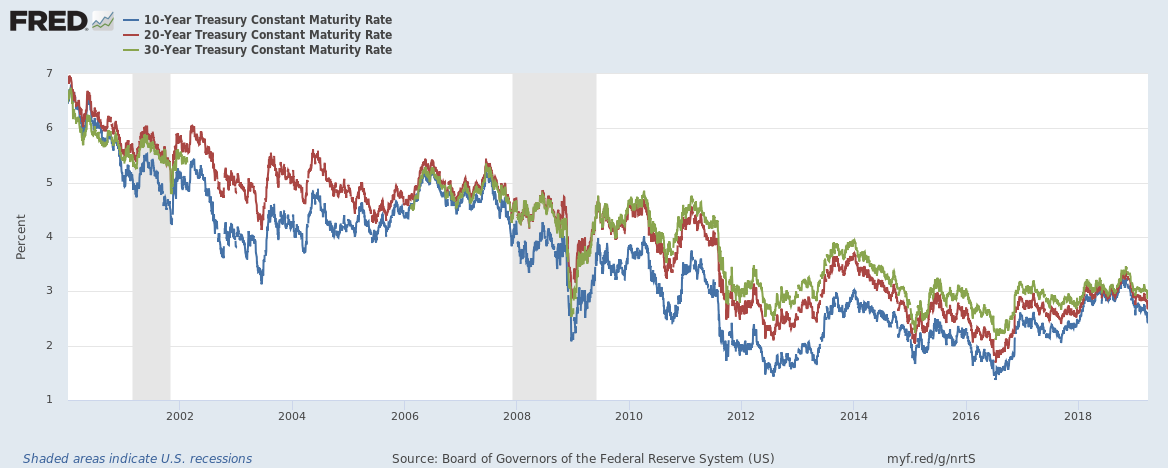
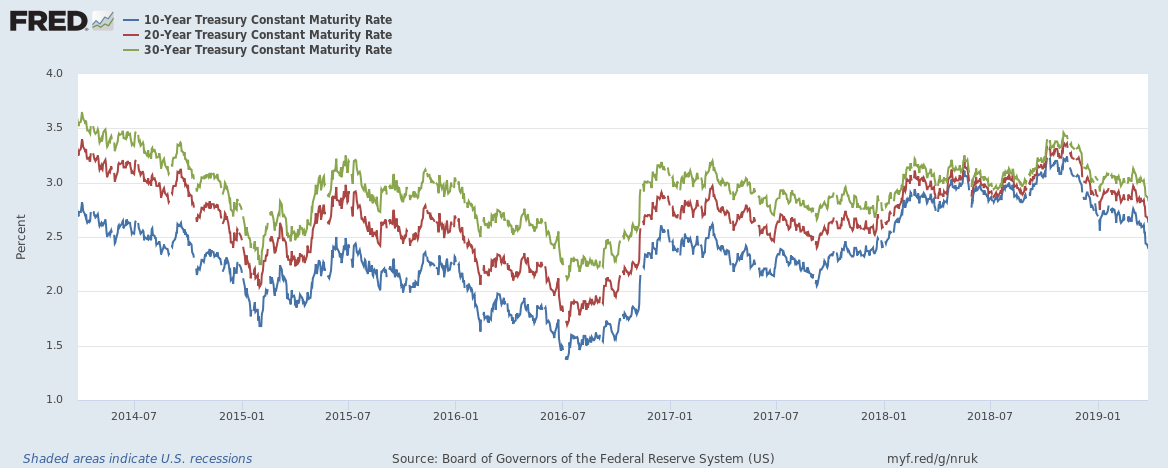
Yields as of the 27th of March 2019 were,
10-year 2.39%
20-year 2.63%
30-year 2.83%
Yields had come close to convergence at the end of 2018 but have diverged again.
Recession?
Just going by these indicators, a U.S. recession is at least 4 quarters away