Home and Rental Vacancy Rate for each state of the United States

The home vacancy rate is the proportion of the homeowner inventory that is vacant for sale.

The rental vacancy rate is the proportion of the rental inventory that is vacant for rent.

Here are the home and rental vacancy rates for each state of the United States (Data Source: U.S. Bureau of the Census),

US Home Vacancy Rate 2017 Map
Data Source: U.S. Bureau of the Census
US Rental Vacancy Rate 2017 Map
Data Source: U.S. Bureau of the Census

Continue reading “Home and Rental Vacancy Rate for each state of the United States”

Intra European Union (EU) Trade Statistics for 2017 – Germany was the largest exporter and importer, the Netherlands had the largest surplus and the United Kingdom the largest deficit

Some surprises in Intra European Union (EU) Trade Statistics for 2017: Germany was the largest exporter as expected but unexpectedly also the largest importer. The Netherlands (and not Germany) had the largest trade surplus. The United Kingdom had the largest trade deficit (no trade deal Brexit still on the table?)

EU Trade Balance 2017
Data Source: Eurostat

Here is additional information, the complete dataset and maps,

Continue reading “Intra European Union (EU) Trade Statistics for 2017 – Germany was the largest exporter and importer, the Netherlands had the largest surplus and the United Kingdom the largest deficit”

Bond yields globally have fallen over the past year other than in the U.S., Canada and Emerging Markets

We haven’t written about bond yields for some time. Government bond yields have largely been falling despite Central Banks announcing reductions or end to their bond buying programmes.

The only notable countries where yields are still up over the past year are the United States, Canada, Italy and Emerging Markets.

It wouldn’t appear that the market is anticipating interest rate rises in the short term. We will write about that in a few days but in the meanwhile here are 10-year government bond yields as of 14th July 2018 (figure in brackets indicate absolute 1-year change),

Continue reading “Bond yields globally have fallen over the past year other than in the U.S., Canada and Emerging Markets”

Here’s how much the balance sheets of the Bank of Japan, the Swiss National Bank, the Federal Reserve and the European Central Bank have grown this century

Central Banks have grown their balance sheets significantly in the past 20 years and almost exponentially since the 2008 financial crisis. Here’s how much the balance sheets of the Bank of Japan, the Swiss National Bank, the Federal Reserve and the European Central Bank have grown in the 21st century,

Bank of Japan

Total assets: 540.8036 trillion Yen (JPY) = 4.93 trillion US Dollars (USD)
As of date: May 1, 2018
Asset size as percentage of GDP: 101% of GDP

Interesting information: The Bank of Japan has a target to buy 6 trillion Yen ($54 billion) worth of exchange traded funds a year. It now holds almost 82% of all ETFs in Japan and is indirectly the largest shareholder in many large Japanese companies, almost about half of listed companies in Japan.

Source: Bank of Japan

Continue reading “Here’s how much the balance sheets of the Bank of Japan, the Swiss National Bank, the Federal Reserve and the European Central Bank have grown this century”

The business of aging – how changing demographics are shaping the economic future in more ways than one

We recently posted about population percentage for each country by age. The data was for 2016 from the World Bank and is the latest set of available data. Here is a map of population percentage for age 65 and above:

And here is a map of interest rates for each country as of June 8, 2018:

See some correlation – direct or inverse?

Continue reading “The business of aging – how changing demographics are shaping the economic future in more ways than one”

Here’s how the unemployment rate has changed for every state in the United States over the past decade

Some states in the United States have done exceptionally well over the past decade creating massive number of new jobs and reporting record low unemployment. There are reports of major labour shortages in at least some states currently.

Here are maps of the unemployment rate in each state in May 2008 and May 2018,

Continue reading “Here’s how the unemployment rate has changed for every state in the United States over the past decade”

Do economic fundamentals matter anymore?

This is a consolidated and slightly edited version of the series on economic fundamentals we ran last month.

Do economic fundamentals matter today? We look at the strange market conditions today. We are living in truly interesting times …

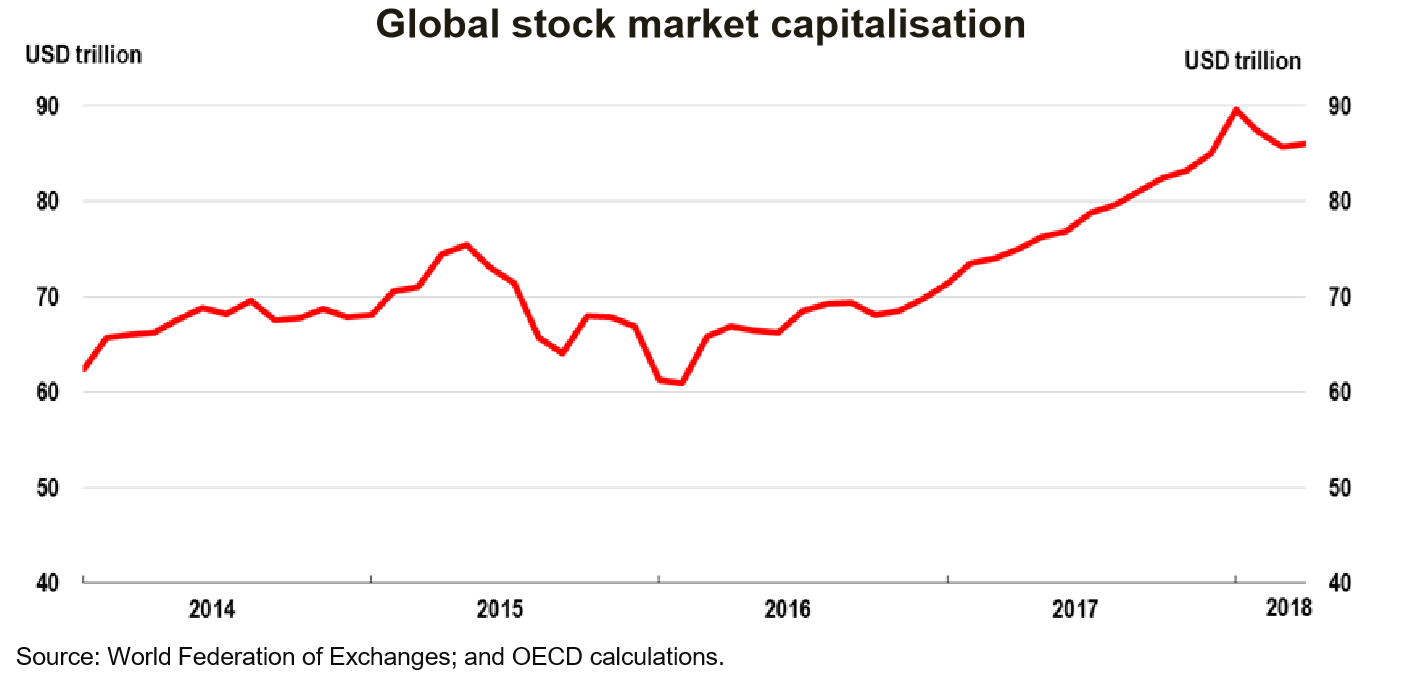
Stock Market Valuations

Equities globally have never been more valuable with market capitalization hitting $90 trillion.

Amazon trades at what a Price to Earnings ratio of some 200. Apple is worth some $900 billion. Even Tesla which makes no profit and is unlikely to make any profit any time soon is worth some $55 billion, more than Ford or General Motors.

Netflix is valued at $159 billion (13.6 times revenues of $11.7 billion) with 110 million paid (and 117 million total) subscribers. Netflix trades at a price to earnings ratio of 220. The company expects free cash flow of -$3 to -$4 billion in 2018 (yes, that is negative cash flow). Yet Netflix’s market cap is now greater than Disney’s and Comcast’s.

Don’t mention fundamentals …

Continue reading “Do economic fundamentals matter anymore?”