Strong or weak economy? We look at
- The personal saving rate
- Consumer loan growth rate
- Growth rate of disposable personal income per capita
- Growth rate of personal consumption expenditures per capita
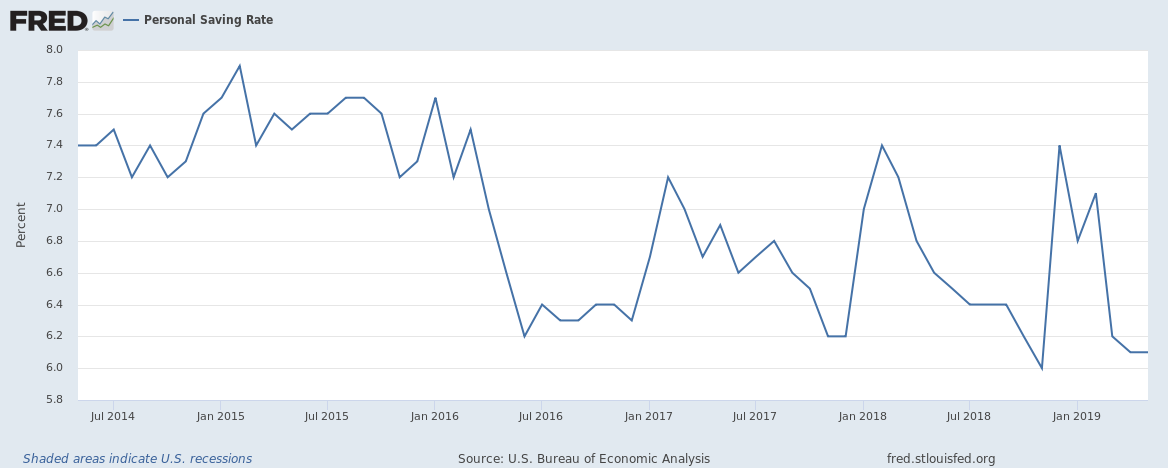
Personal saving rate
At the end of May 2019, the personal saving rate in the U.S. was 6.1%. It has been falling over the past year. The rate is the personal saving as a percentage of disposable personal income. Are people saving lesser because they are spending more or because their income growth is slowing?
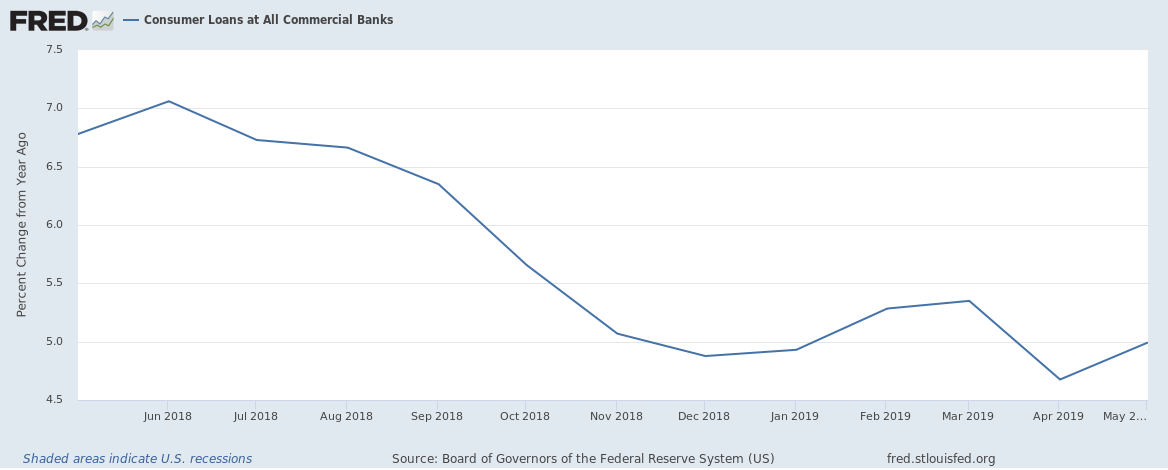
Consumer loan growth rate
The consumer loan growth rate (against a year earlier) was 5% at the end of May 2019. The growth rate has fallen over the past year. Are consumers borrowing less because they are worried about the future of the economy and/or have consumer borrowing growth rates peaked?
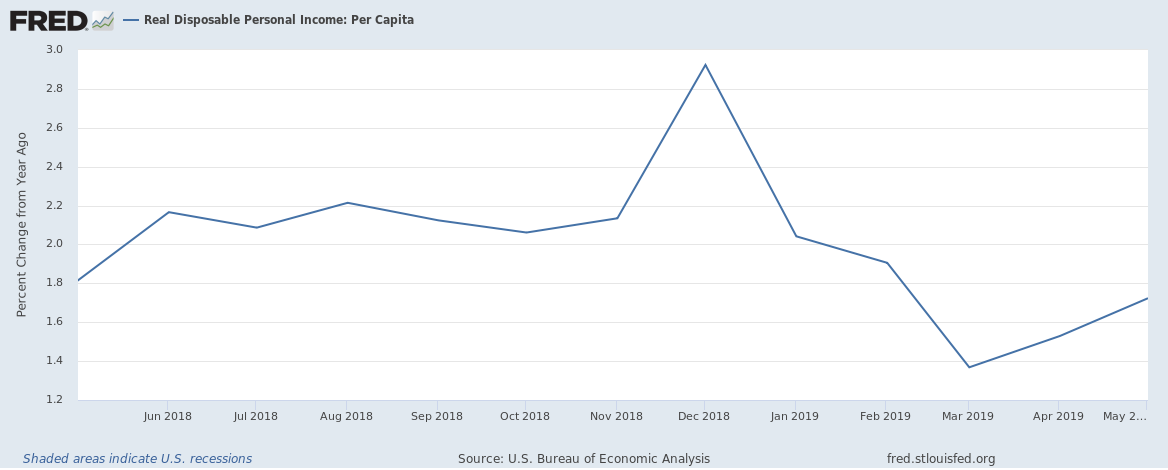
Growth rate of disposable personal income per capita
Disposable per income per capita grew at 1.7% in May 2019, down from 3% at the end of 2018. Slowing wage growth or expenses growing quicker than income? A bit of both.
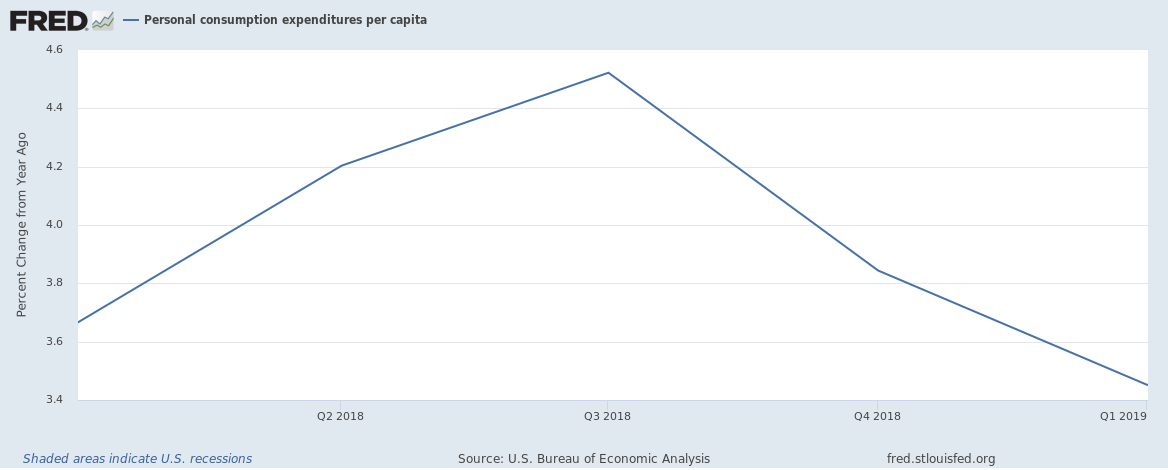
Growth rate of personal consumption expenditures per capita
Personal Consumption Expenditure per capita grew at 3.5% at the end of Q1 2019, down from 4.6% at the end of Q3 2018. Lack of confidence in the economy or lower inflation? Inflation hasn’t fallen much so it is more likely a fall in confidence levels in the economy.