We will write about the current U.S. fiscal situation in depth later during the month but in the meanwhile here is the story in some graphs.
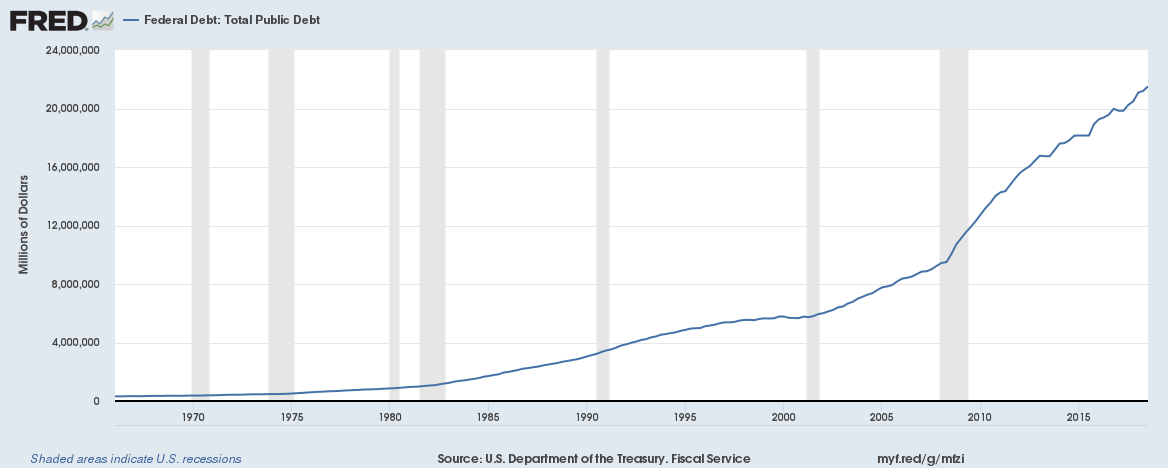
The total Federal debt (doesn’t include individual state debt) now stands at $21.52 trillion,
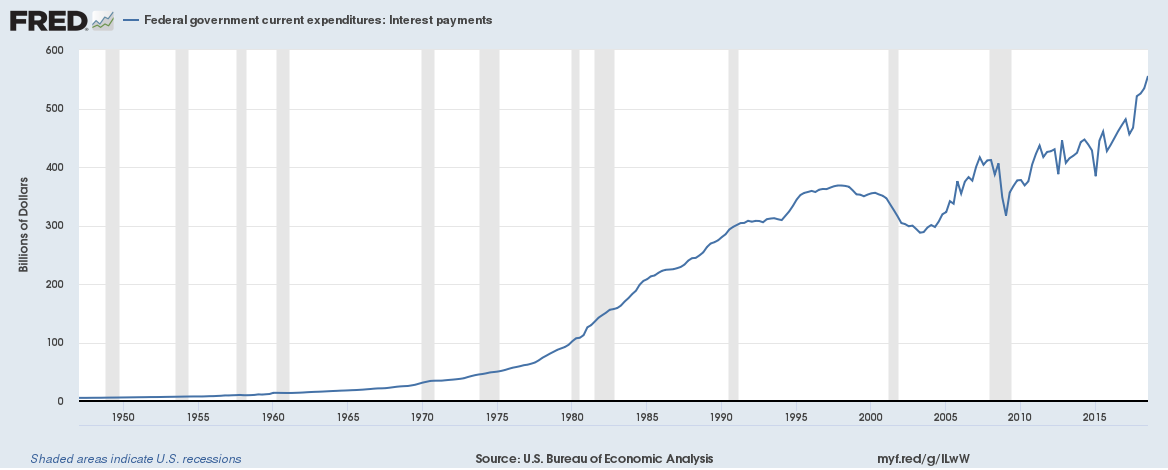
Interest payments are soaring, with annualized interest payments now running at $555.58 billion,
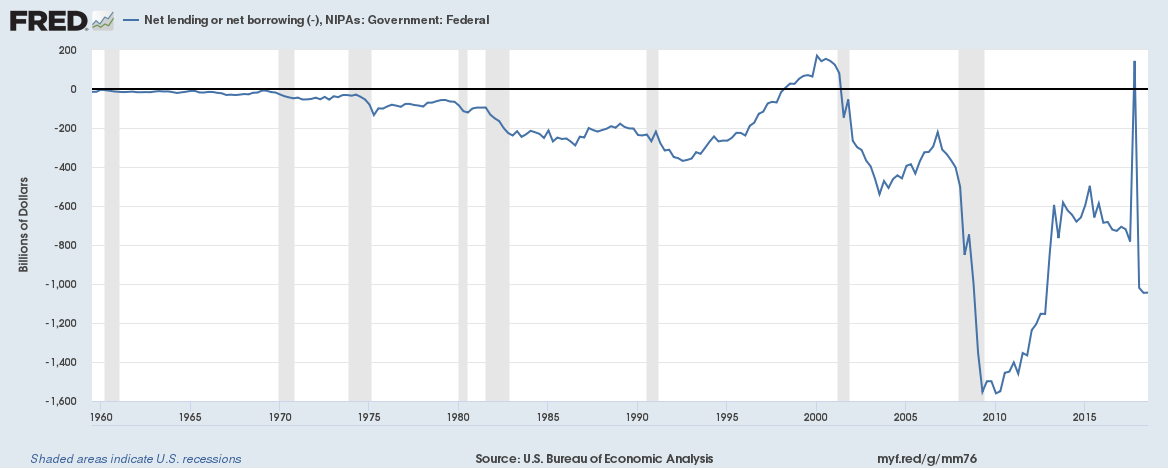
The fiscal deficit has been worsening and the last time the there was a budgetary surplus was in 2001,
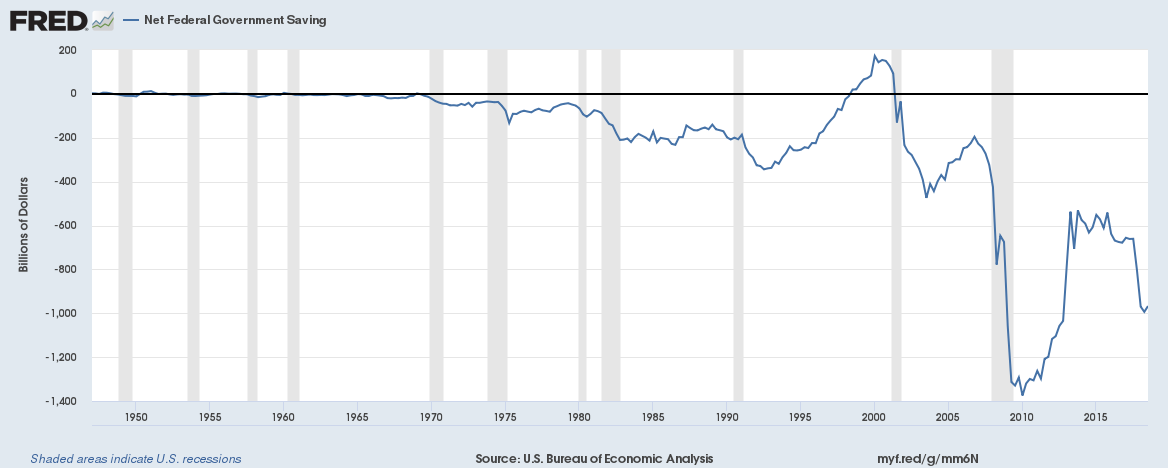
Looking at government expenditure vs income,
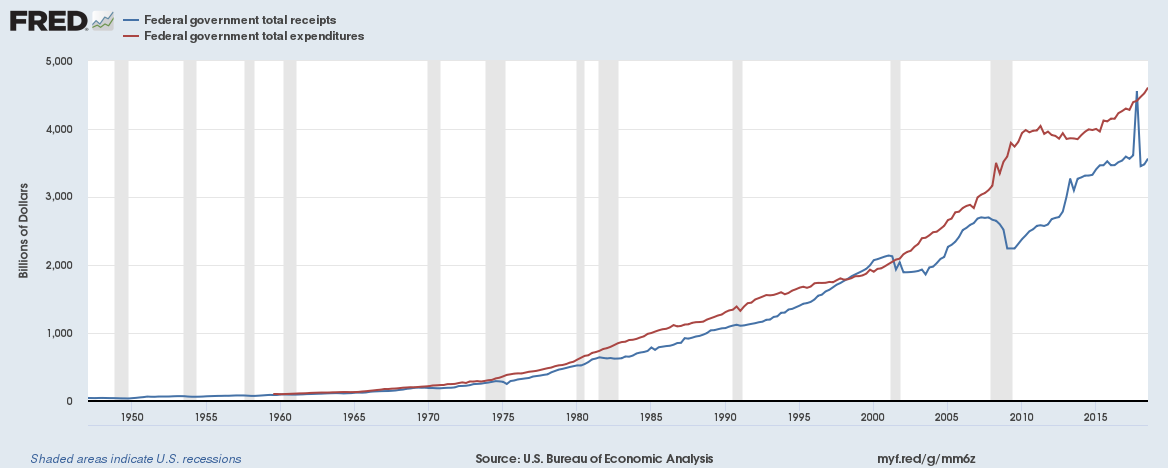
Expenditure is growing quicker than income,
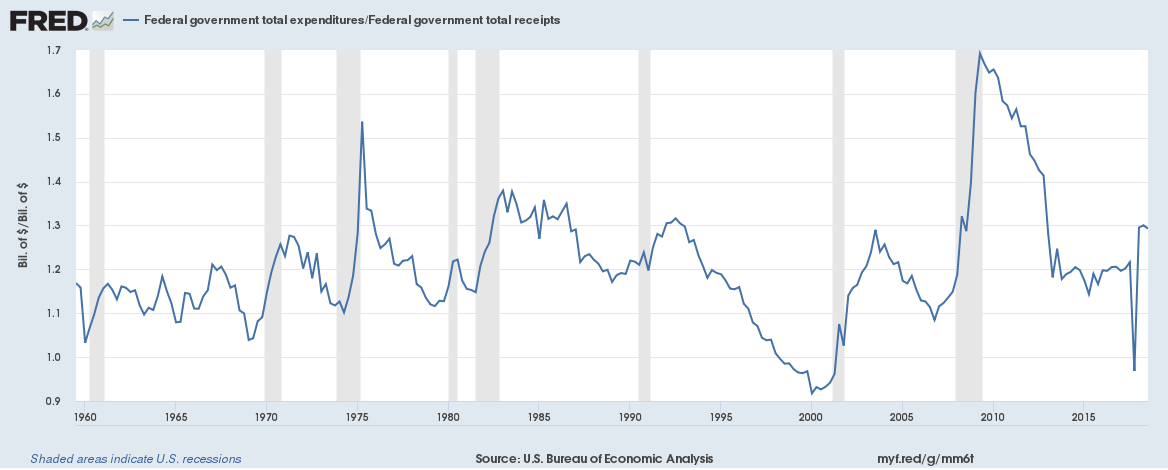
The graph below says is all, the expenditure to income ratio is currently 1.29 which means the U.S. government spends $1.29 for every $1 in income. And even though historically the government has spending more than it earns there is an acceleration in the ratio at the moment,
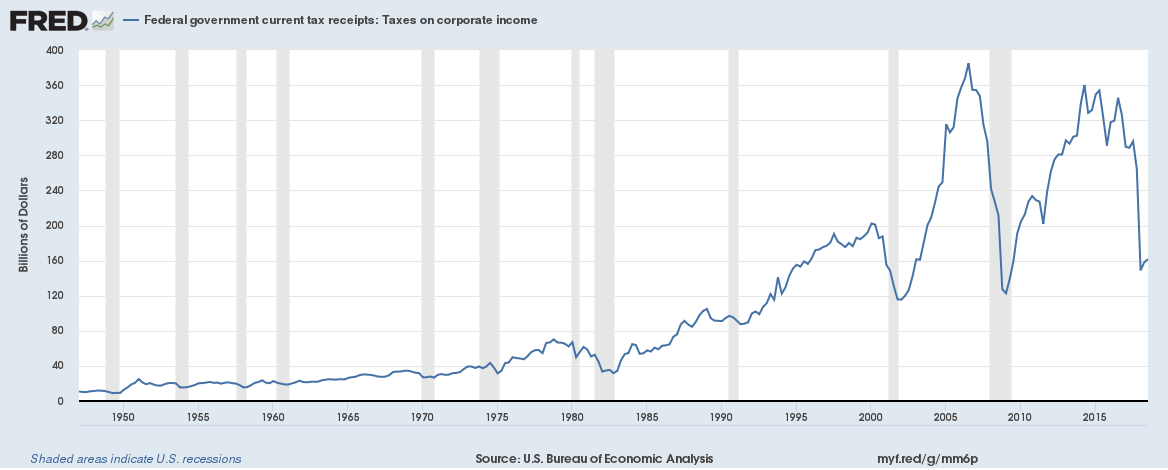
The main cause of the rising ratio is falling tax receipts due to tax rate cuts,
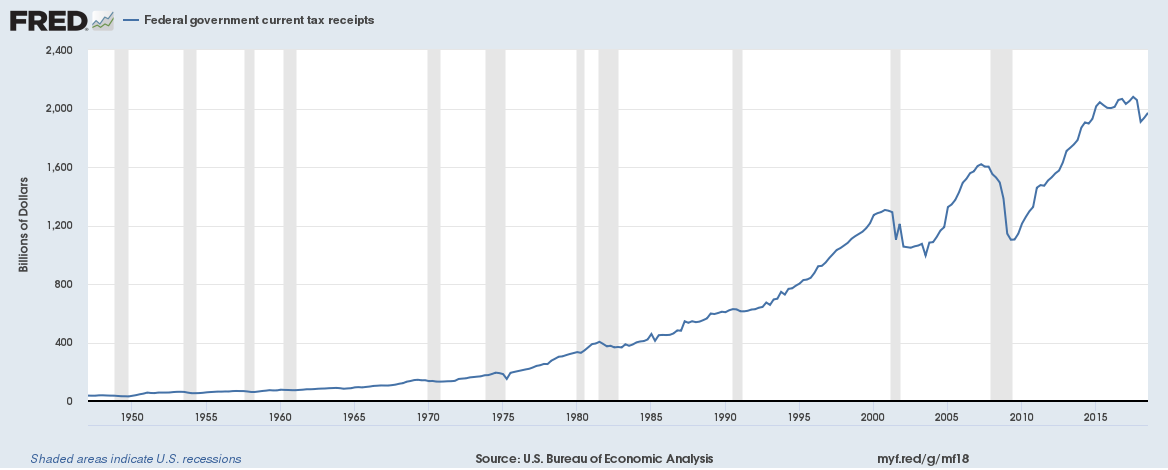
… which are mainly down to falling corporate taxes given the deep tax rate cut,
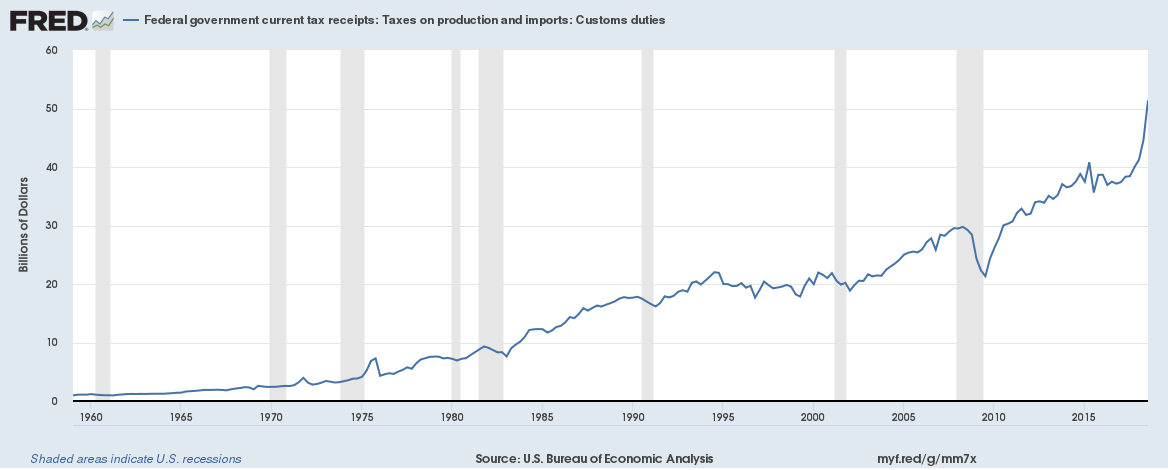
Custom Duties are up though given the trade war induced tariffs,
If the U.S. was a corporation (rather than a country/government) with persistent borrowing, ever increasing debt and expenditure running at a pace quicker than income in an environment of rising interest payments (and rates) it would probably be rated quite badly by the rating agencies. But, there you go, the U.S. in only amongst a handful of countries left with a AAA rating.