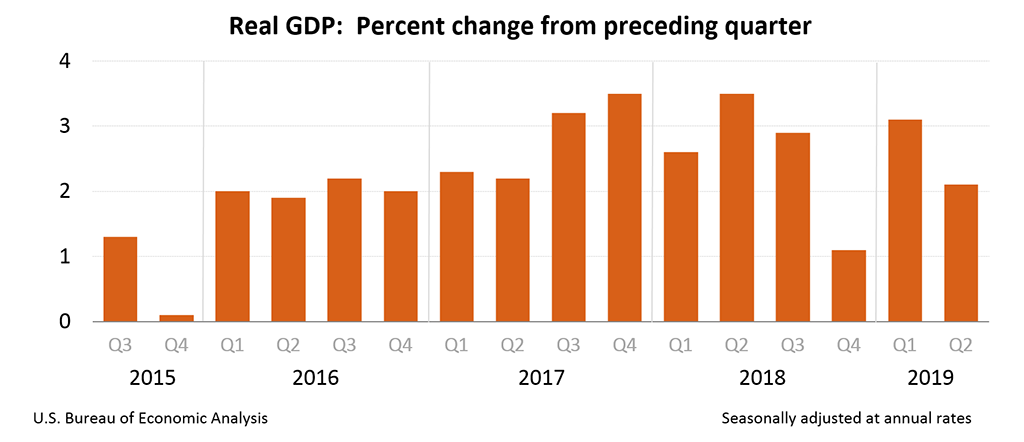
Real gross domestic product (GDP) for the United States increased at an annual rate of 2.1% in the Q2 2019 (vs 3.1% in Q1 2019), according to the advance estimate released by the Bureau of Economic Analysis.
The increase in real GDP in Q2 2019 reflected positive contributions from personal consumption expenditures (PCE), federal government spending, and state and local government spending that were partly offset by negative contributions from private inventory investment, exports, non-residential fixed investment and residential fixed investment. Imports, which are a subtraction in the calculation of GDP, increased.
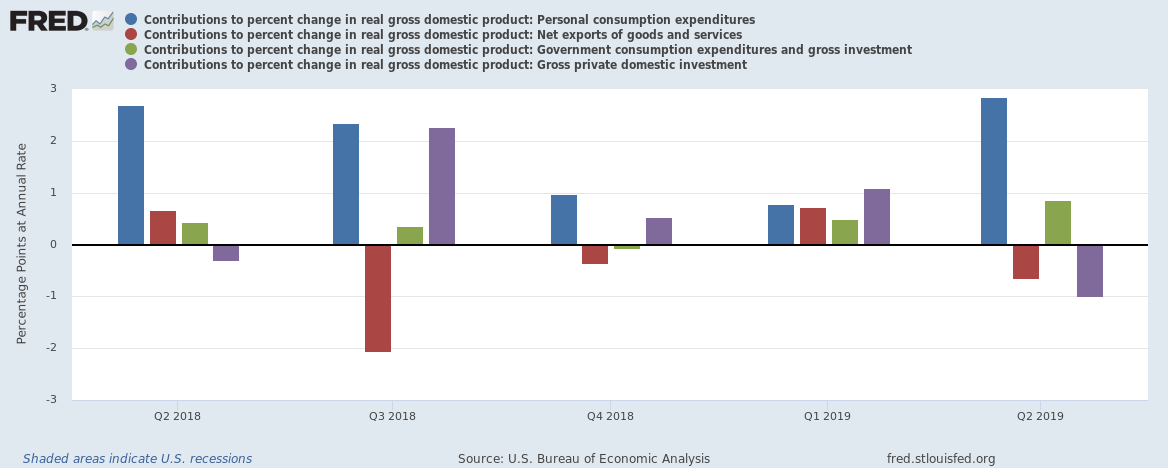
The deceleration in real GDP in the second quarter reflected downturns in inventory investment, exports, and non-residential fixed investment. These downturns were partly offset by accelerations in PCE and federal government spending.
Current-dollar GDP increased 4.6%, or $239.1 billion, in the second quarter to a level of $21.34 trillion. In the first quarter, current-dollar GDP increased 3.9%, or $201.0 billion.
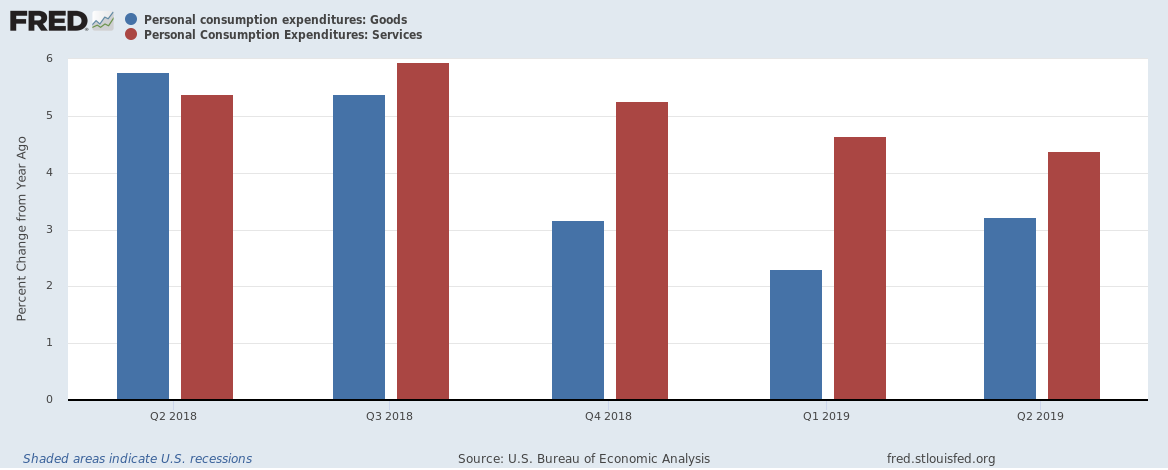
The price index for gross domestic purchases increased 2.2% in the second quarter, compared with an increase of 0.8% in the first quarter. The PCE price index increased 2.3% compared with an increase of 0.4%. Excluding food and energy prices, the PCE price index increased 1.8% compared with an increase of 1.1%. Most of the growth is coming from increased expenditure in services (mainly soaring healthcare expenditure),
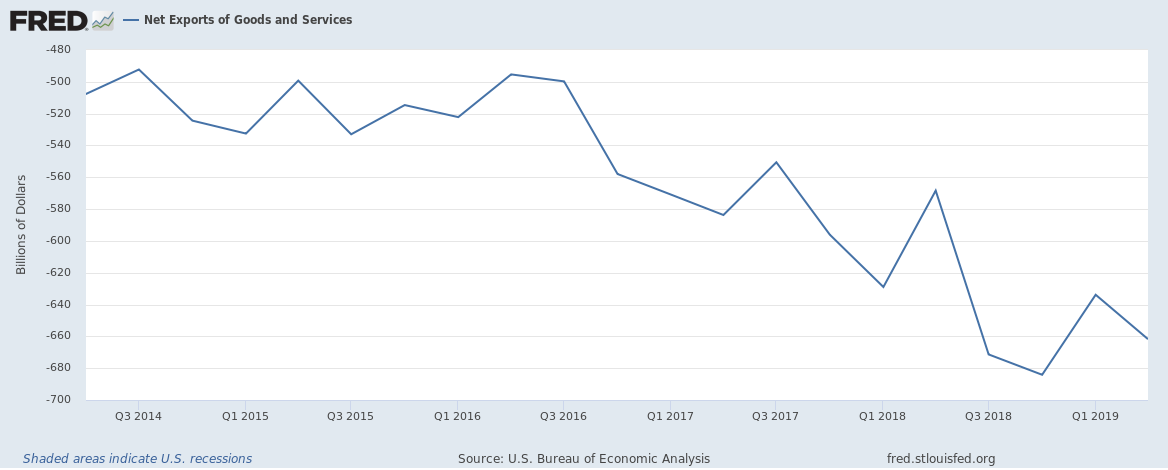
Despite the ongoing trade wars, the trade deficit for the U.S. is rising causing a negative impact on GDP growth.
Current-dollar personal income increased $244.2 billion in the second quarter, compared with an increase of $269.8 billion in the first quarter. Decelerations in compensation and in personal current transfer receipts were partly offset by an upturn in personal income receipts on assets and a deceleration in contributions for government social insurance (a subtraction in the calculation of personal income).
Disposable personal income increased $193.4 billion, or 4.9%, in the second quarter, compared with an increase of $190.6 billion, or 4.8%, in the first quarter. Real disposable personal income increased 2.5 %, compared with an increase of 4.4%.
Personal saving was $1.32 trillion in the second quarter, compared with $1.37 trillion in the first quarter. The personal saving rate which is the personal saving as a percentage of disposable personal income was 8.1% in the second quarter, compared with 8.5% in the first quarter.
Related:
U.S. Q4 2018 GDP growth estimated at 2.6%; 2018 GDP growth at 2.9%
The U.S. fiscal deficit hit $1.06 trillion in 2018 but is it really that bad?
U.S. corporate profitability accelerated in 2018 growing at 16% … or 8%