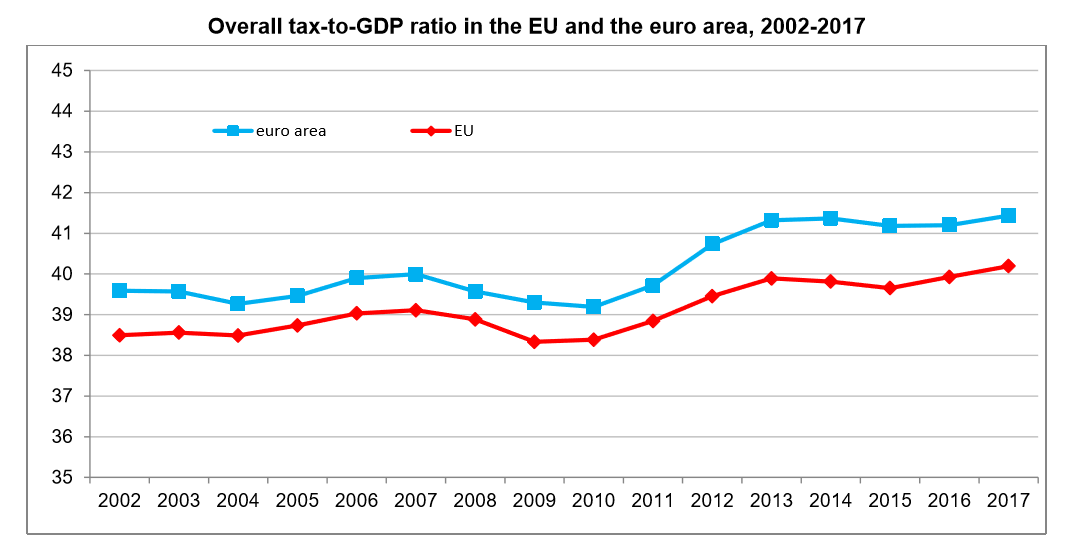
The overall tax-to-GDP ratio, which is the sum of taxes and net social contributions as a percentage of Gross Domestic Product, stood at 40.2% in the European Union (EU) in 2017 and 41.4% of GDP for the Eurozone in 2017. These were the highest ever levels for both the European Union and Eurozone.
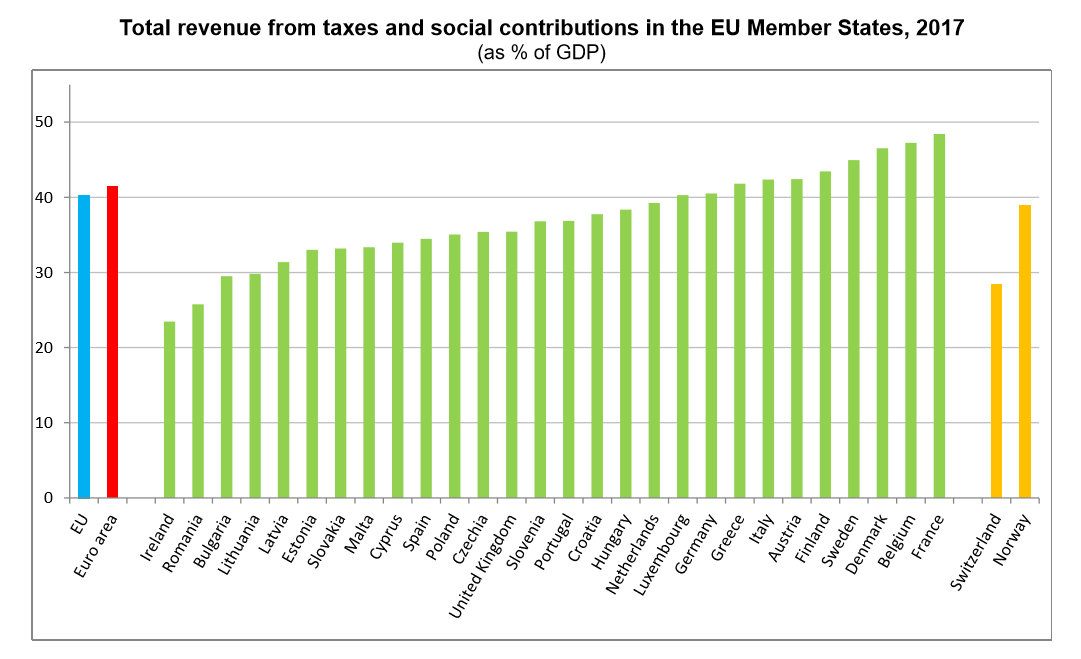
The tax-to-GDP ratio varies significantly between Member States, with the highest share of taxes and social contributions in percentage of GDP in 2017 being recorded in France (48.4%), Belgium (47.3%) and Denmark (46.5%), followed by Sweden (44.9%), Finland (43.4%), Austria and Italy (both 42.4%) as well as Greece (41.8%).
At the opposite end of the scale, Ireland (23.5%) and Romania (25.8%), ahead of Bulgaria (29.5%), Lithuania (29.8%) and Latvia (31.4%) registered the lowest ratios.
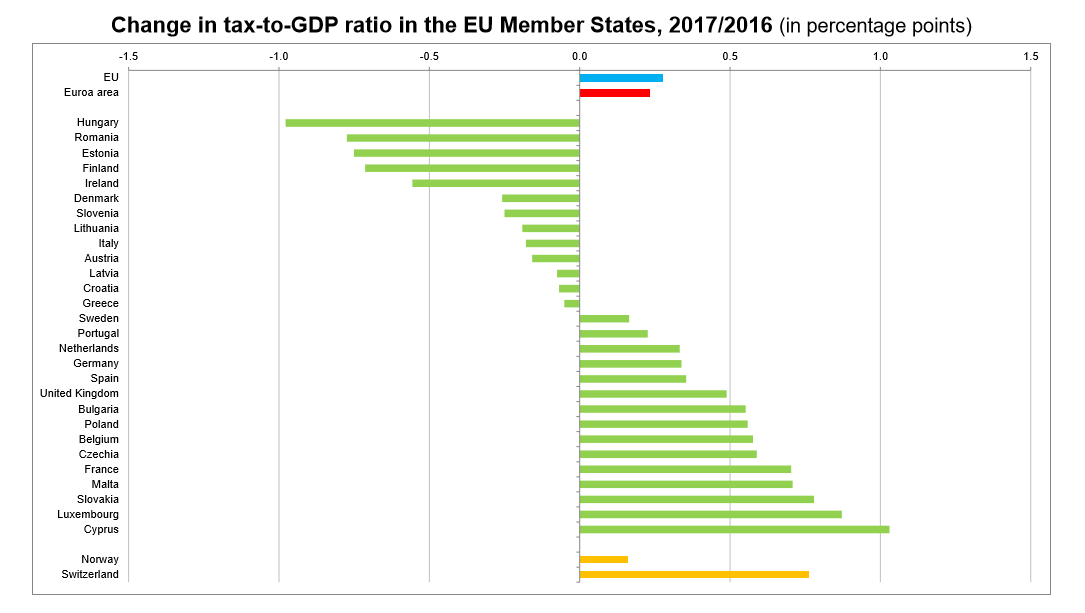
Compared with 2016, the tax-to-GDP ratio increased in fifteen Member States in 2017, with the largest rise being observed in Cyprus (from 32.9% in 2016 to 34.0% in 2017), ahead of Luxembourg (from 39.4% to 40.3%) and Slovakia (from 32.4% to 33.2%).
In contrast, decreases were recorded in thirteen Member States, notably in Hungary (from 39.3% in 2016 to 38.4% in 2017), Romania (from 26.5% to 25.8%) and Estonia (from 33.8% to 33.0%).
The Eurozone or Euro area includes Belgium, Germany, Estonia, Ireland, Greece, Spain, France, Italy, Cyprus, Latvia, Lithuania, Luxembourg, Malta, the Netherlands, Austria, Portugal, Slovenia, Slovakia and Finland.
The European Union (EU) currently includes Belgium, Bulgaria, Czechia, Denmark, Germany, Estonia, Ireland, Greece, Spain, France, Croatia, Italy, Cyprus, Latvia, Lithuania, Luxembourg, Hungary, Malta, the Netherlands, Austria, Poland, Portugal, Romania, Slovenia, Slovakia, Finland, Sweden and the United Kingdom.
Related:
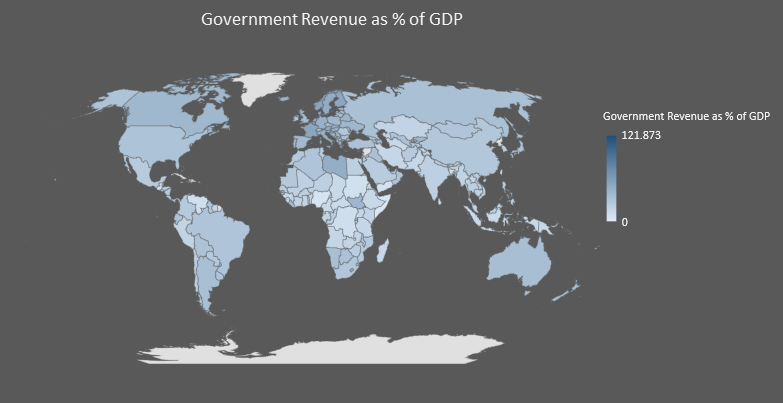
Government Revenue as percentage of GDP for each country