We wrote about three slightly different U.S. recession indicators that have been predictive of the past few recessions and have been tracking how near or far are those from being invoked, here’s where we are at the end of 2018,
The UK economy a decade on from the 2008 recession
A decade after the beginning of the great recession of 2008, how has the United Kingdom economy recovered?
Continue reading “The UK economy a decade on from the 2008 recession”
Those three U.S. recession indicators – how near or far are those from being invoked? September 2018 edition
We wrote about three slightly different U.S. recession indicators that have been predictive of the past few recessions and have been tracking how near or far are those from being invoked, here’s where we are in September 2018,
Those three U.S. recession indicators – how near or far are those from being invoked?
We wrote recently about three slightly different U.S. recession indicators that have been predictive of the past few recessions. How near or far are those from being invoked?
30-year and 10-year Treasury yield
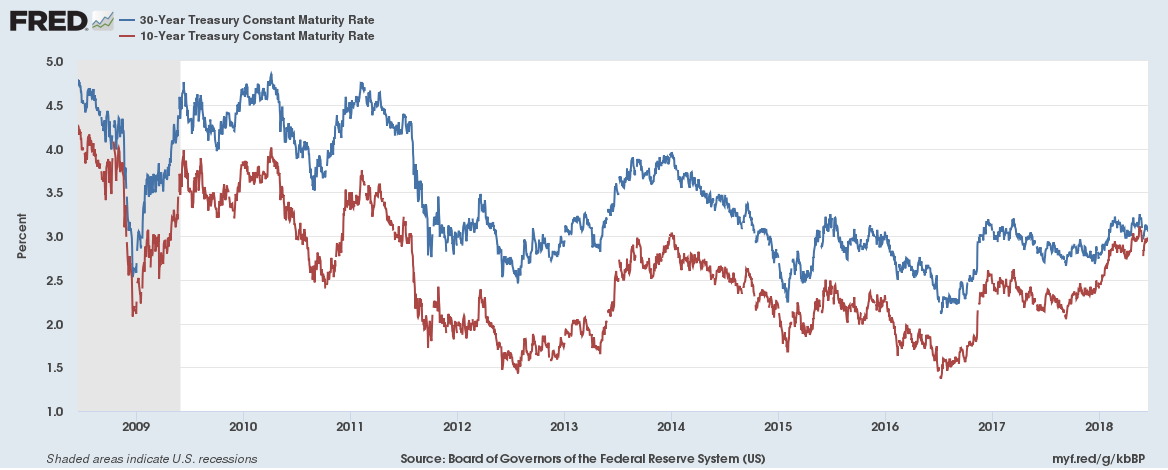
The 10-year Treasury yield has been greater than the 30-year Treasury yield three to six months before each of the past four. Currently the difference is just 19 bps.
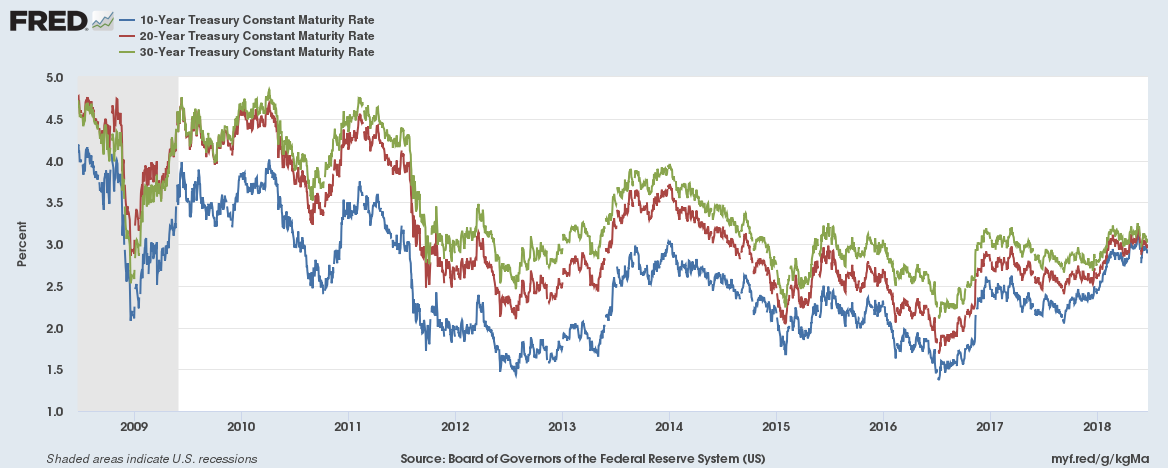
And the 30-year, 20-year and 10-year Treasury yields have almost converged three to six months before each of the past five recessions as well. The 20-year yield already 3 bps higher than the 30-year yield, they have been converging for the past two weeks.
Three slightly different US recession indicators
Here are three slightly different US recession indicators that have been predictive of the past few recessions,
30-year and 10-year Treasury yield
The 10-year Treasury yield has been greater than the 30-year Treasury yield three to six months before each of the past four recessions. Graph below for the past decade, the shaded areas indicate recessions,
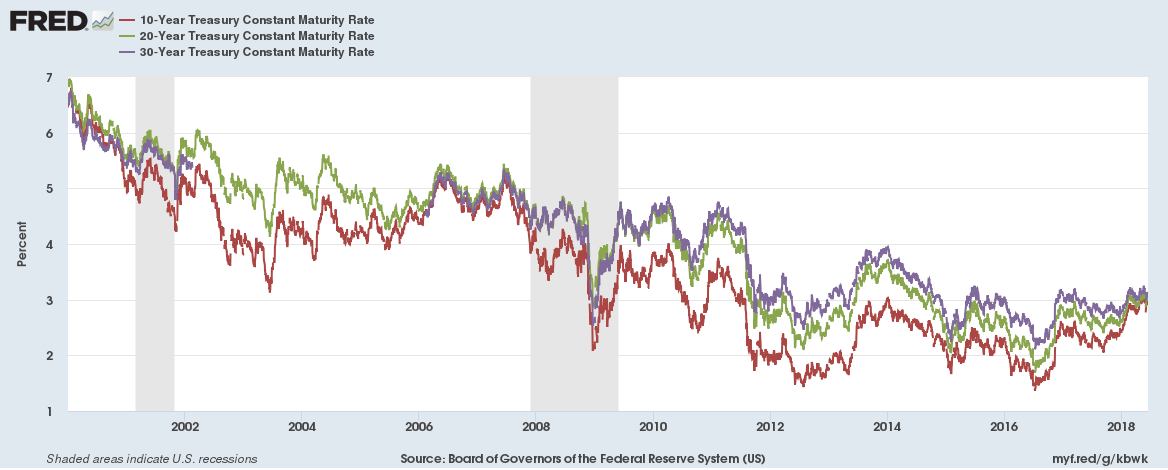
And the 30-year, 20-year and 10-year Treasury yields have almost converged three to six months before each of the past five recessions as well. Graph below, the shaded areas indicate recessions,
Continue reading “Three slightly different US recession indicators”