Is the global economy slowing? We look at four charts – lumber prices, iron ore prices, aluminium prices and the Baltic Dry index.
Continue reading “Is the Global Economy Slowing? Four Commodity Charts”
Why wouldn’t it be?
Is the global economy slowing? We look at four charts – lumber prices, iron ore prices, aluminium prices and the Baltic Dry index.
Continue reading “Is the Global Economy Slowing? Four Commodity Charts”
The Baltic Dry Index is a trade indicator that measures shipping prices of major raw materials and is often seen as a global growth indicator. The index is based on a daily survey of agents all over the world.
The Baltic Dry Index is down 48% over the past month (and down 47% over the past year). Is this an indicator of more trouble around global growth?
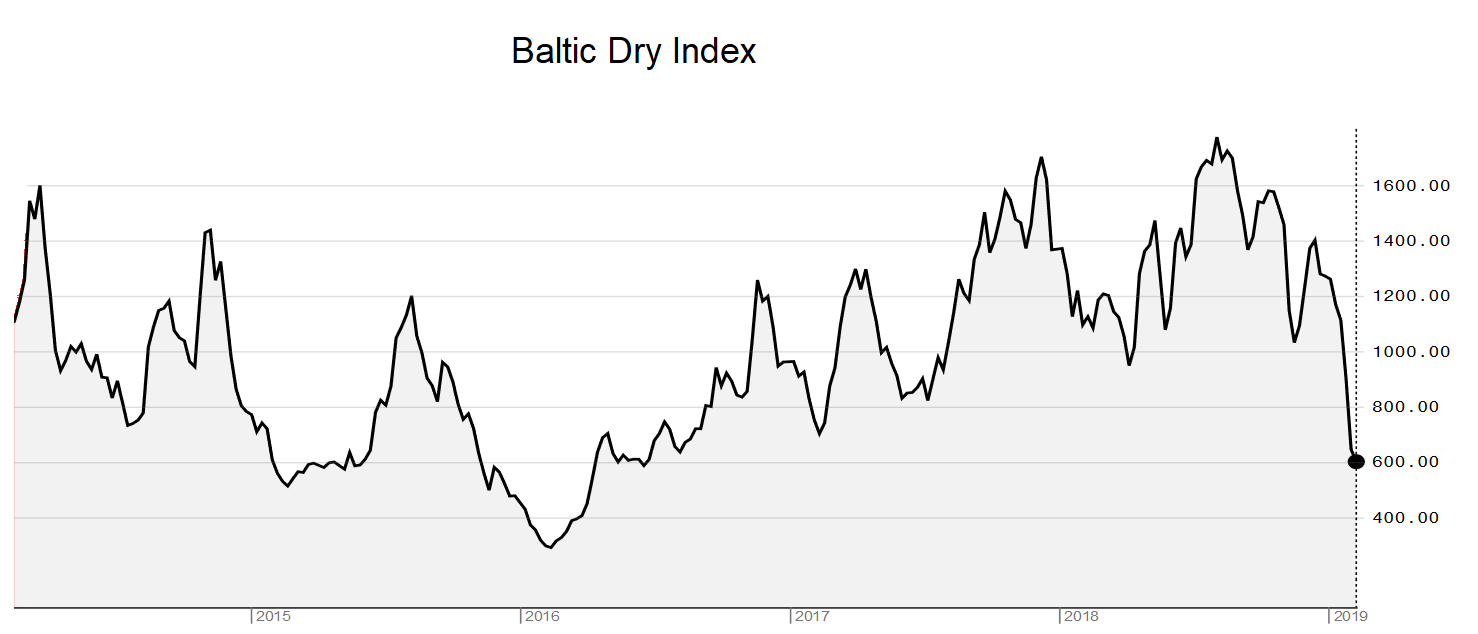
Continue reading “The Baltic Dry Index is down 48% over the past month”
Here is the 1-year change for Equity, Commodity and Bond Markets (all as of end of day December 13, 2018),
Equities
Red almost everywhere with China down 20%, Germany down 16%, South Korea down 15%, U.S. almost flat (Dow Jones and S & P 500 flat with NASDAQ 100 up 6%) and star performer Brazil up 21%
We will write a lot more about the economy over the weekend but in the meanwhile here are two charts,
U.S. crude has continued its longest losing streak since it began trading in New York more than three decades ago having plunged more than $20 a barrel since the start of October when it hit a 4-year high. Oil prices fell 8% today. From shortage fears to over-supply concerns …
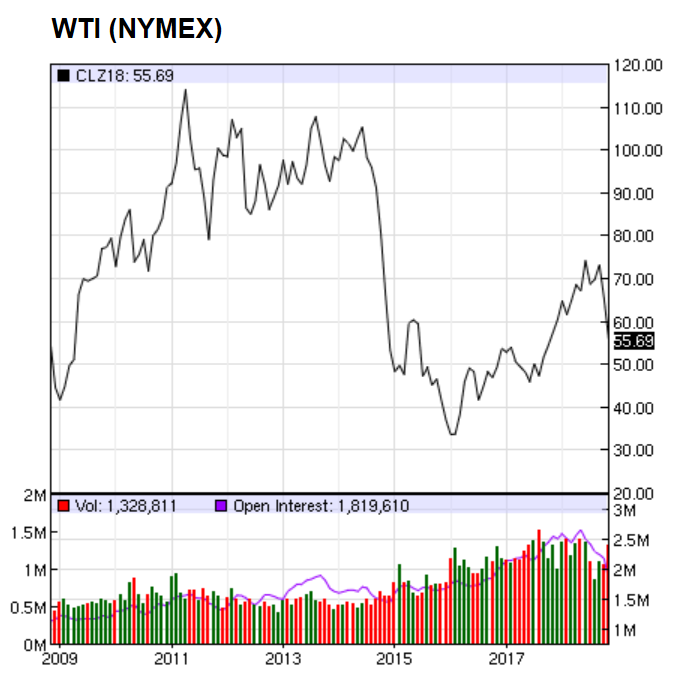
Continue reading “Just two charts – Oil and the Baltic Dry Index”
Everyone seems to be focussing on the equity markets recently, but equity markets haven’t really moved much over the past one month. Over the past month, major equity markets have lost between 1.5% to 4%.
The real action is in bonds and commodities. And trade seems to be flourishing too.
10-year government bond yields of major economies are lower by 5% to 40% (in relative terms not absolute terms) in just the past month. 10-year German bonds are down 12 bps over the past month. That wouldn’t sound much but they are down 28% from 42 bps to 30 bps. U.K. yields are down 8%, U.S. yields down 5%, Japanese yields down 40%. Even Greek yields are down 20% over just the past month. Does the market anticipate a pause in interest rate rises? It would appear so.
Continue reading “Something strange is happening in the global economy right now”
Emerging Markets are being routed with rising oil and a soaring US dollar
Here is the performance of the US dollar against emerging market currencies (figures in brackets are 1-month % change),
USD/MXN – Mexico 19.9450 (+8.17%)
USD/INR – India 67.9850 (+3.23%)
USD/TRY – Turkey 4.4894 (+10.07%)
USD/BRL – Brazil 3.7375 (+10.33%)
USD/ZAR – South Africa 12.7550 (+6.71%) Continue reading “Weekly Overview: Emerging Market Rout; New Italian Government; Japan GDP; Oil surge continues”
Oil Prices
The price of crude oil crossed $70 per barrel today, the highest since November 2014.
US firm ConocoPhillips has taken over oil inventories and terminals of Venezuelan state-owned PDVSA under court orders to enforce a $2 billion arbitration award by the International Chamber of Commerce. Further, US President Donald Trump said he’d announce his decision on the Iran nuclear deal on Tuesday. Both developments contributed to soaring oil prices. Continue reading “Oil highest since November 2014; Dollar index hits its highest level in 2018; Warren Buffett and Bill Gates on Cryptocurrencies”
Oil prices closed at $67.39 on Friday, gaining 8.6% during the week and hitting a 3-year high. Like we covered here, the impact of oil prices is being felt with oil dependent companies like airlines already seeing margins squeezed.
Meanwhile, US 2-year Treasury bonds hit a high of 2.373%, the highest since September 9, 2008 (if the date sounds familiar it was just 5 days before Lehman Brothers entered Chapter 11 administration). Continue reading “Weekly overview: Oil prices hit 3-year high; US 2-year Treasury yields highest since September 2008; Subprime is making a comeback”
Crude oil at $65.5 a barrel is up 23% over the past year and Brent is up some 27% during the same period. Gasoline prices are up 16% over the past year and we aren’t yet in the US driving season (which pushes up the price and begins in July). Continue reading “Crude oil is up 23% over the past year and it has started making an impact; US 3-year bond yields at a 11-year high”
1. Hong Kong’s Hang Seng Index is up 34% over the past year.
2. Tencent Holdings (the owner of WeChat – the WhatsApp equivalent in China and several other things) is up 116% over the last year. It is currently worth over $550 billion and is most valuable social media company (bigger than Facebook).
3. Ping An Insurance (Ping An Insurance Group Company of China Ltd) is now the world’s largest and most valuable insurance company. Its stock is up 110% over the year. Continue reading “Here are some interesting things you may have missed in the equity, commodity, currency and bond markets”